- Education
- Forex Technical Analysis
- Basic Concepts
- Forex Trend
Forex Trend: Trend Lines in Technical Analysis
One of the basic concepts of technical analysis is the trend. It is based on assumption that market participants make decisions in herds making asset price movements sustainable for some time.
Formation
Depending on the prevailing direction of prices an asset may be in an upward trend, in a downward trend, in a sideways trend or have no apparent trend.
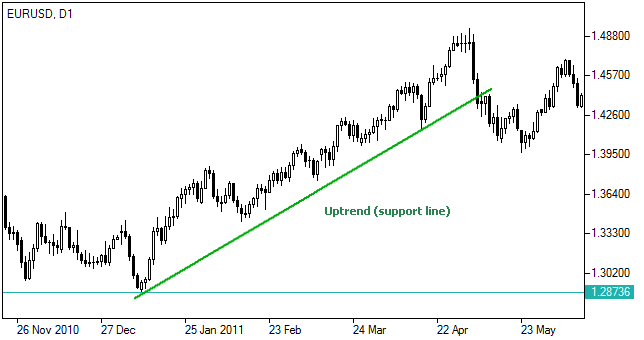
- An upward trend is characterized by prices going to higher local highs and higher local lows. An upward trendline connecting the lows acquires positive slope.
- A downward trend is characterized by prices making lower local highs and lower local lows. A downward line connecting the highs acquires negative slope.
- A sideways trend is drawn by two horizontal trendlines which prevent prices from large upward or downward movements, keeping fluctuations in a certain range.

Interpretation
- An upward trend suggests that forces of demand are greater than forces of supply making investors to pay higher and higher prices for the same asset. However a break below the trendline (plus certain deviation is widely common) may be a sign of trend weakness and be considered a sell signal.
- A downward trend suggests that supply is overwhelming demand as sellers agree to accept lower and lower prices for the same asset. The downtrend is expected to continue until prices break above the trendline (plus certain deviation is widely common), sending a buy signal.
- A sideways trend indicates relative balance between demand and supply forces and the price is expected to stay inside the range indicated by the trendlines until one of them is broken.
