- Education
- Forex Technical Analysis
- Technical Indicators
- Bill Williams Indicators
- Awesome Oscillator
Awesome Oscillator - AO Indicator
What is Awesome Oscillator?

The creator of the Awesome Oscillator, as well as several other indicators and oscillators, is the famous trader Bill Williams. In fact, the AO was a kind of addition to the Williams Alligator - another “invention” of Bill Williams, and the MACD mechanism was adopted as the basis for its creation, albeit with significant changes.
While indicators that show market sentiment and its trends are inherently “lagging”, oscillators not only confirm trends, but also predict possible impulses and movements. The Awesome Oscillator detects the prevalence of bullish or bearish forces in the market by comparing the recent momentum (5 bars) with the wider trend (34 bars): the 34-period SMA is subtracted from the 5-period SMA.
Moreover, the 34-period and 5-period simple moving averages are calculated not by closing prices, as is the case of many indicators, but by the midpoints of the bars (arithmetic averages of the highs and lows for the chosen timeframe).
The peculiarity of AO is that the periods are set by B. Williams himself and are not subject to change. The Awesome Oscillator is rarely used alone in Forex and CFD trading, but it is very effective together with other oscillators and indicators.
How to Use Awesome Oscillator
It is rare to find a trading strategy based on just one indicator, most often Awesome Oscillator is used in conjunction with others. For example, there are some popular strategies based on: 1) Awesome Oscillator (AO), Accelerator Oscillator (AC) and Parabolic SAR indicator, 2) Stochastic, Awesome and Accelerator oscillators, 3) EMA and Awesome Oscillator. There are 3 methods of trading using the signals supplied by the Awesome Oscillator only.
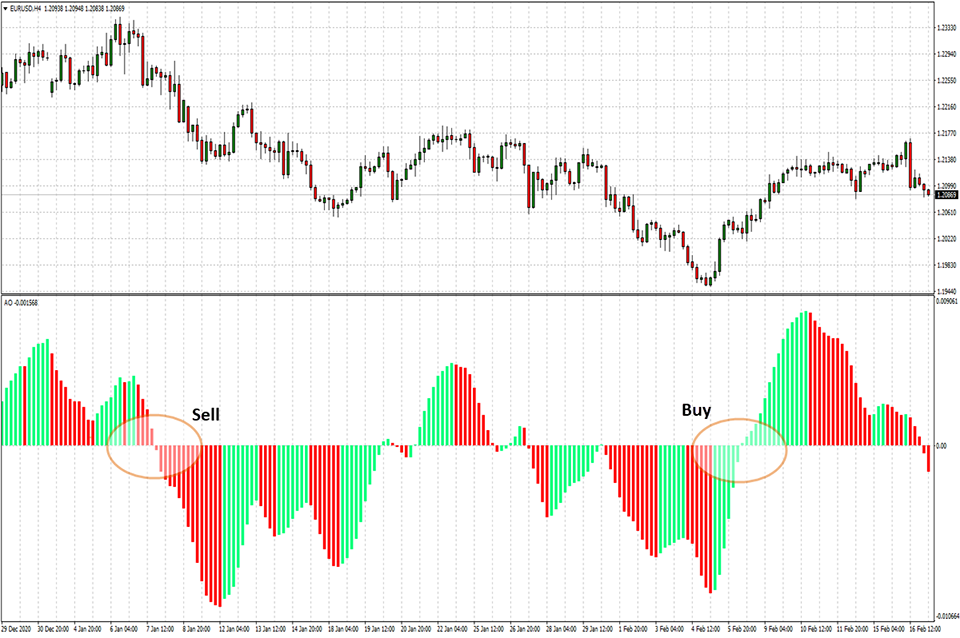
1. Zero Line Crossover Pattern Strategy
Open a sell position, when the oscillator crosses the Zero Line from top to bottom, or open a buy position, when the signal crosses the Zero Line from bottom to top.

2. Awesome Oscillator Twin Peaks
Open a sell position, when the oscillator forms two peaks above the zero line, with the second peak lower than the first one. And vice versa, open a buy position, when the oscillator forms two lows below the zero line, with the second low higher than the previous one.

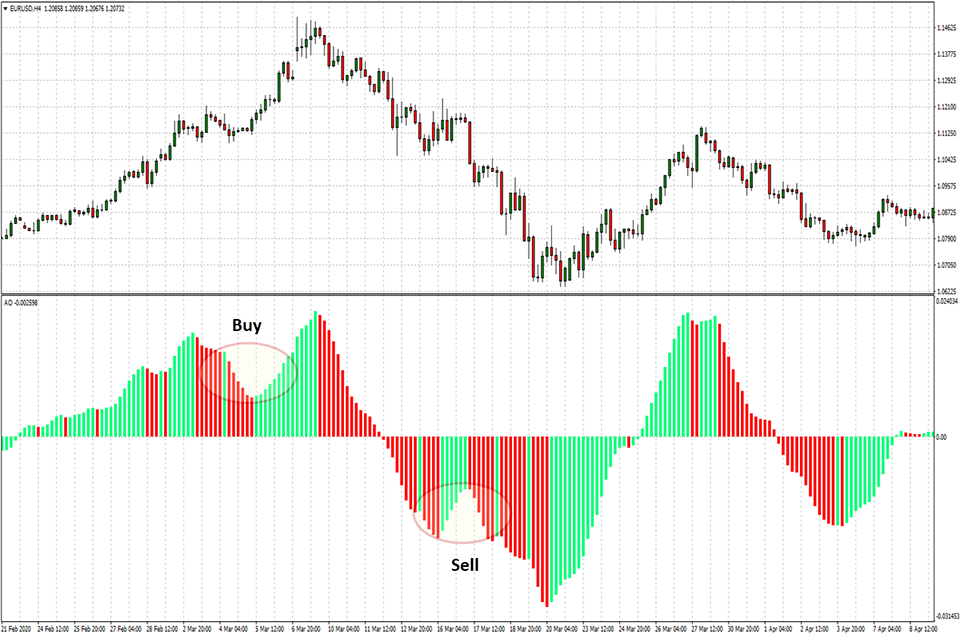
3. Awesome Oscillator Saucer
The third strategy recommends to open a buy position, when the signal bars of the bullish “Saucer” are above the zero level, or open a sell position, when the bars of the bearish “Saucer” are in the negative zone.

Obviously, the Awesome Oscillator (AO) indicator is quite in demand among traders, so it has found its place in the standard set of the trading terminal: in the “Navigator” window of your trading terminal tap the “Indicators” option and you will find 4 categories: Trend, Oscillators, Volumes, and Bill Williams; click “Bill Williams” and select the Awesome Oscillator (AO) from the list.
As we have already noted, the parameters set by the creator of the AO cannot be changed, the only thing that a trader can alter to his taste is the color of the bars, which are green and red by default. If AO is used alone, the risks of false signals or their misinterpretation increase. More commonly, AO is used in conjunction with other oscillators and indicators, and also has signal filtering functions.
Awesome Oscillator Formula
Awesome Oscillator is a 34-period simple moving average, plotted through the central points of the bars (H+L)/2, and subtracted from the 5-period simple moving average, graphed across the central points of the bars (H+L)/2.
MEDIAN PRICE = (HIGH+LOW)/2
AO = SMA(MEDIAN PRICE, 5)-SMA(MEDIAN PRICE, 34)
where:
SMA - Simple Moving Average;
HIGHT - highest price of the bar;
LOW - lowest price of the bar;
Awesome Oscillator Strategy
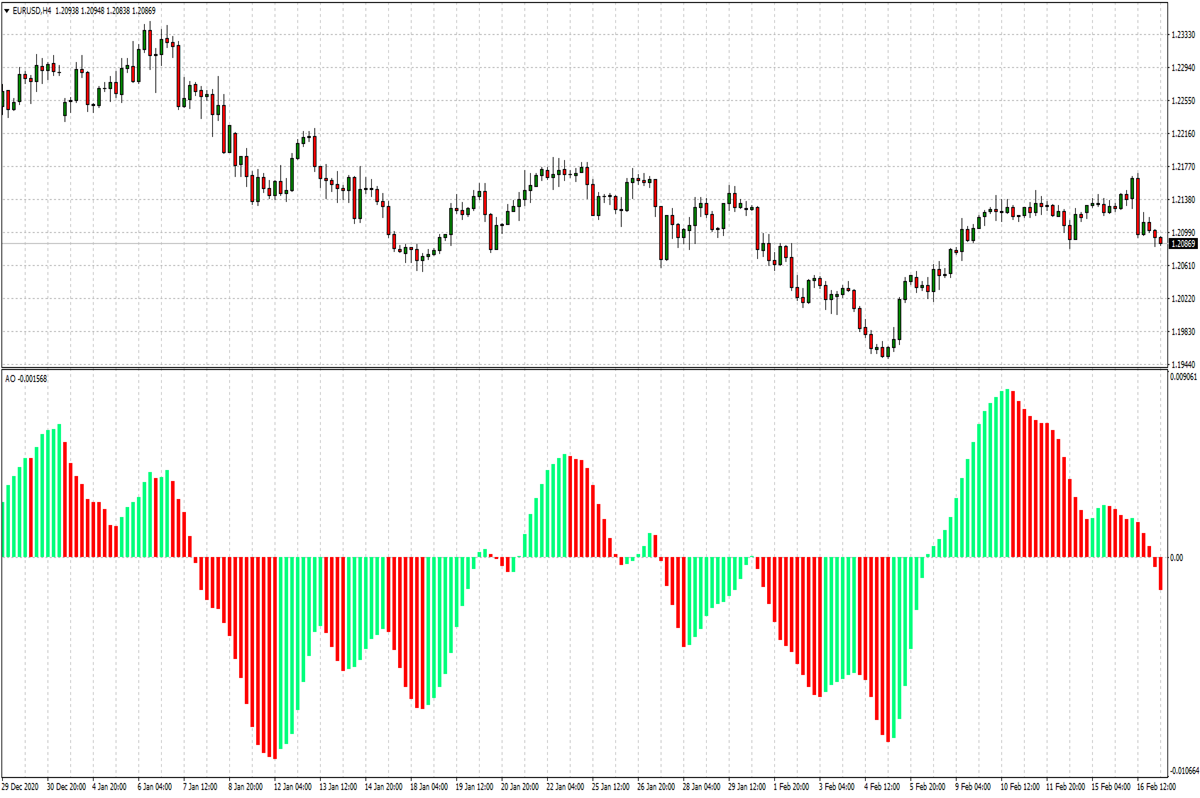
The oscillator is depicted as a histogram consisting of red and green bars (the default color). The bar is colored green if it is higher than the previous one, and red if it is lower. The bars show the divergence of the 5- and 34-period moving averages.
The oscillator builds its bars above and below the zero line depending on whether the 5-period MA is above or below the 34-period MA. In the first case, AO will have a positive value, and its bars will line up above the zero line. In the second case, we will see the oscillator bars below the zero level. As the trend increases, the moving averages will diverge more, and the oscillator bars will stretch more up or down (with bullish and bearish trends, respectively).
How to use Awesome Oscillator in trading platform
Forex Indicators FAQ
What is a Forex Indicator?
Forex technical analysis indicators are regularly used by traders to predict price movements in the Foreign Exchange market and thus increase the likelihood of making money in the Forex market. Forex indicators actually take into account the price and volume of a particular trading instrument for further market forecasting.
What are the Best Technical Indicators?
Technical analysis, which is often included in various trading strategies, cannot be considered separately from technical indicators. Some indicators are rarely used, while others are almost irreplaceable for many traders. We highlighted 5 the most popular technical analysis indicators: Moving average (MA), Exponential moving average (EMA), Stochastic oscillator, Bollinger bands, Moving average convergence divergence (MACD).
How to Use Technical Indicators?
Trading strategies usually require multiple technical analysis indicators to increase forecast accuracy. Lagging technical indicators show past trends, while leading indicators predict upcoming moves. When selecting trading indicators, also consider different types of charting tools, such as volume, momentum, volatility and trend indicators.
Do Indicators Work in Forex?
There are 2 types of indicators: lagging and leading. Lagging indicators base on past movements and market reversals, and are more effective when markets are trending strongly. Leading indicators try to predict the price moves and reversals in the future, they are used commonly in range trading, and since they produce many false signals, they are not suitable for trend trading.
Use indicators after downloading one of the trading platforms, offered by IFC Markets.

Was this article helpful?


