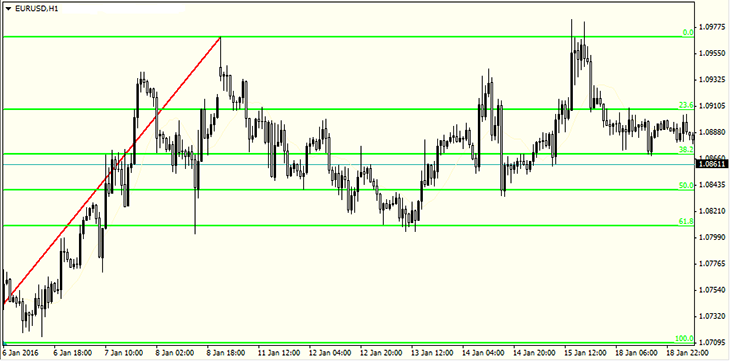
Fibonacci levels are considered to be important and effective tools of technical analysis for determining the possible levels of trend reversal. By taking them into account the trader can determine the strong support and resistance levels, as well as the possible targets of correction and continuation trends.
Fibonacci Numbers
The Fibonacci sequence of numbers became popular in Europe thanks to an Italian mathematician Leonardo Pisano (Fibonacci), although, this sequence had been known in the East long before him. The sequence presents a series of numbers, where each subsequent number is the sum of the previous two: 3, 5, 8, 13, 21, 34, 55, etc. In addition, if any of the numbers of this sequence is divided into the following number, then the result will be approximately equal to 0.618, and if it is divided into the previous number, then the result will be 1,618. This sequence was used in the financial market by the famous trader Ralph Elliott. In his theory of waves, Ralph noticed that the ratio of the height of the next wave to the previous one is approximately equal to 1,618.
Fibonacci levels: How to use?
Practically, in any platform there is an instrument “Fibonacci Lines” with the help of which one can create correction levels - 0%, 23,6%, 38.2%, 50%, 61.8%, 76,4% and 100%. The Fibonacci lines also allow to determine the target of correction in case the trend continues – it is 161.8%, 261.8% and 423.6%. In case of an uptrend, the lines should be stretched from bottom to top, and in case of a downtrend – from top to bottom.

Trading on Fibonacci levels
Trading on Fibonacci levels involves the opening of a long positions in case of a rebound from the support line, when the market goes up, and the opening of a short position in case of a rebound from resistance level, when the market goes down.
Since Fibonacci levels are supposed to be support and resistance levels then trading based on these levels is conducted in the same way as in trading strategies based on support and resistance levels.
