- Education
- Forex Technical Analysis
- Chart Patterns
- Reversal Patterns
- Diamond
Diamond Chart Pattern: Forex Chart Pattern
The brilliant graphical price pattern serves for existing trend reversal confirmation in case of its occurrence on the chart. Traditionally it appears in an uptrend.
Formation
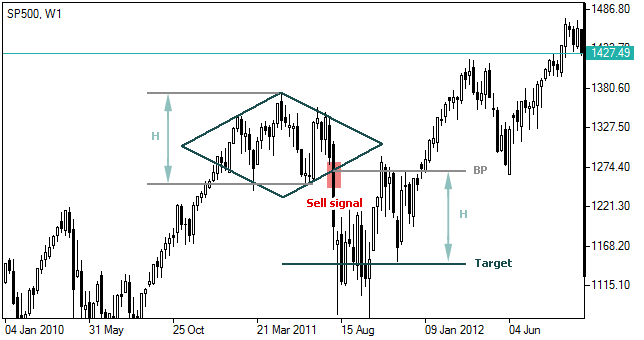
Diamond Chart pattern is characterized by four limited trend lines representing two support lines below and two resistance levels above which respectively connect the most recent lows and highs, visually forming a figure shaped as a brilliant or a rhomb as price fluctuations amplitude initially widens and then narrows.

Interpretation of Forex Diamond
As soon as a support line at the right is violated (plus a certain deviation is possible), it can be interpreted as change in direction of the trend downwards and serves as a sell signal.
Target price
Following brilliant pattern formation the price is generally believed to fall at least to its target level, calculated as follows:
T = BP – H, Where:T – target level;
BP – right support breakthrough point;
H – pattern’s height (distance between pattern’s bottom and top).

Not sure about your Forex skills level?
Take a Test and We Will Help You With The Rest
You can see the graphical object on the price chart by downloading one of the trading terminals offered by IFC Markets.


