- नवाचार
- PCI के आवेदन पर लेख
- स्प्रेड ट्रेडिंग
Stock Market against Precious Metals. Which is Stronger?
Financial markets have cyclical nature, with investment capital flowing from gold and silver to "paper" assets and vice versa. Worldwide, investors prefer to keep their funds in the form of precious metals when the state of the economy is poor, during crises, wars and defaults, when there is no trust to the stock market. During conventional economic stability, investors prefer securities to precious metals and invest in the stock market. The USA is currently considered one of the largest holders of gold reserves among separate countries, and the American stock market is the largest in the world. Let’s consider the interrelation between these markets. In order to understand the market of precious metals, discover its main differences from other instruments popular in the world financial markets we will turn to the weekly chart of DJI (Dow Jones Industrial Average index) against a basket composed of equal shares of gold and silver.
For creating the chart we use a unique method known as PQM, which is available on the latest version of the trading-analytical terminal NetTradex. PQM method is a new method of graphical analysis of markets, which allows compiling a portfolio of assets from the list of assets available in NetTradeX platform, and determining the value of one portfolio against another. Moreover, these portfolios can contain any number of assets, and each asset can have any weight in the overall structure.
The value of all assets in a portfolio is automatically converted into U.S. dollars, which makes portfolio comparison possible, automatically creating a new financial unit - a composite instrument PCI (personal composite instrument).
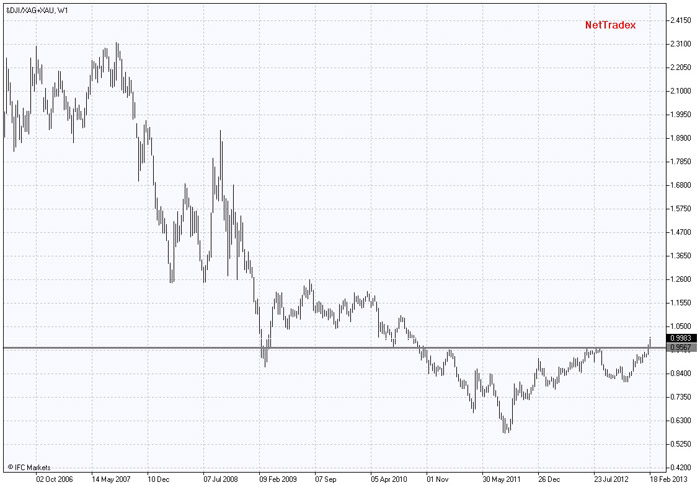
In the following chart one portfolio includes the DJI index, and the second portfolio includes equal shares of gold and silver. Both portfolios have current values of 100 000 U.S. dollars.
The chart shows the relationship between these two portfolios in a weekly time frame from 2006 up to the present time. In general, over the last 60 years, the overall trend remains slightly bullish (it is important to note that dividends are not taken into account here, real return denominated in gold and silver would be much higher in case they are). Generally highs and lows in this relationship coincide with reversion points of cyclical bullish and bearish markets. We can see that before another collapse of stock market in 2008 in the chart created at the end of 2006 and mid-2007 there were formed double tops, and then during several years, there was observed a long, continuous decline.
New deep bottom was reached in the middle of 2011. With a high probability it can be stated that at thit point the bearish cycle was ended, and now we can see a reversal and the beginning of the next large cyclical market. And, interestingly, this happens on the background of record new highs of the DJI and a deep correction in the markets of gold and silver. On the chart there is a price pattern very similar to the well-known reversal model of technical analysis "inverse head and shoulders". And, if it is truly completed, then, following a possible correction in the US stock market, the relative growth of the Dow Jones against precious metals (gold and silver) may continue.
On the basis of this assumption, in case of focusing on the medium and long-term trading strategies, we can choose a convenient moment for buying American stocks or stock indexes against gold and silver.

पिछले लेख
- जापानी शेयर बाजार बनाम अमेरिकी शेयर बाजार का प्रदर्शन
- अमेरिकी शेयर बाजार बनाम जर्मन शेयर बाजार के प्रदर्शन की तुलना
- अंतरपणन व्यापार | FCATTLE/SOYB - क्षमता विश्लेषण
- PCI: कमोडिटी फ्यूचर्स - कॉफी बनाम कोको
- कृषि फ्यूचर्स पर PCI : गेहूं वायदा और फीडर मवेशी
- नई कॉर्पोरेट रिपोर्ट - Google स्टॉक, Apple स्टॉक
