- Education
- Introduction to Trading
- What is a Bull Trap
What is a Bull Trap - Bull Trap Example
In the world of financial markets, chart patterns serve as essential tools for traders and investors to make informed decisions. These patterns help identify potential trend reversals and profit opportunities.
However, amidst the various patterns that arise, one phenomenon known as a "bull trap" has the potential to deceive even the most experienced market participants.
In this article, we will delve into the concept of a bull trap, exploring its definition, characteristics, and the potential risks it poses to traders. By examining a real-life example, we aim to shed light on the intricacies of this deceptive pattern, offering valuable insights for market participants.
So, join us as we unravel the mysteries of bull traps and gain a deeper understanding of their implications in chart patterns.
What is a Bull Trap
A bull trap is like a trick played by the market. Imagine a scenario where a stock, index, or some other security shows a strong rally, making it seem like it's on an upward trend. This convinces many traders and investors to jump in and buy, hoping to ride the wave and make profits. They believe they've found a golden opportunity.
But here's the catch: the price suddenly reverses and starts declining, breaking a previous support level. This unexpected turn of events catches those optimistic folks off guard, and they end up trapped in their long positions, facing losses instead of gains.
In simpler terms, it's like being lured into a false sense of security. The market tricks you into thinking it's going up, but then it abruptly changes direction and goes down, leaving you scratching your head and regretting your decision to buy. It's frustrating because the initial rally seemed so convincing, making you believe it was a great time to get in on the action. But alas, it turns out to be a trap.
Sometimes, a bull trap is also referred to as a whipsaw pattern. It's like getting caught in a sudden back-and-forth motion, just like a whipsaw cutting through wood. The price movement deceives you with a strong rally, only to swiftly reverse and go in the opposite direction, causing confusion and generating losses for those who fell for the trap.
Traders and investors need to be cautious and use various tools and strategies to spot potential bull traps. It's important to be aware of support levels and not blindly jump into buying based on a temporary rally. Paying attention to market signals, analyzing trends, and managing risks can help avoid falling into these tricky situations.
Enhance your trading experience - download MetaTrader 4 now to access a wide range of robust tools and features designed to support your analysis and execution of trades.
How to Identify Bull Trap: Bull Trap Example
Let's consider an actual example to demonstrate how to identify a bull trap:
Suppose you're analyzing the price chart of a popular cryptocurrency, let's say Bitcoin (BTC). The market has been in a downtrend for a while, with prices steadily declining. Suddenly, there's a significant rally, and Bitcoin breaks above a key resistance level, signaling a potential trend reversal.
Traders and investors start getting excited, and positive news headlines emerge, fueling the bullish sentiment. Many people interpret this breakout as a signal to buy Bitcoin, expecting a sustained upward movement. However, as you analyze the situation, you notice some indications of a potential bull trap:
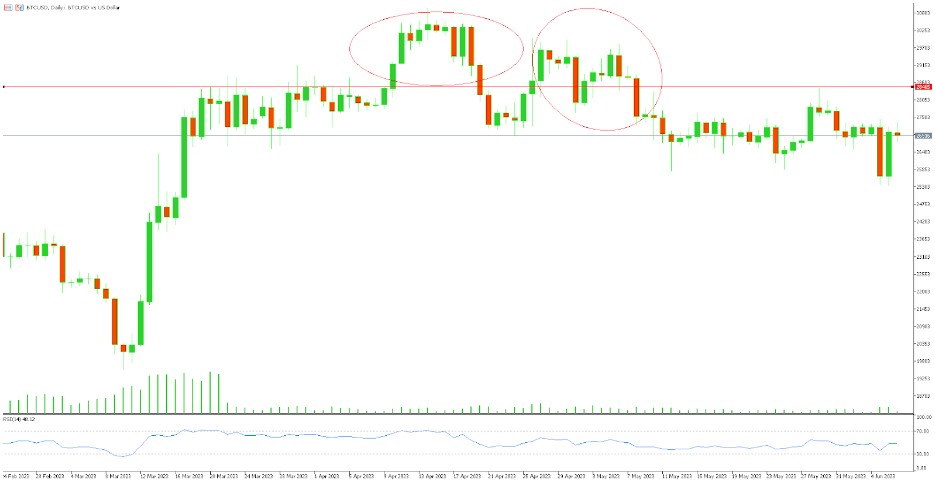
1. Resistance Turned Support
After the initial breakout, the price of Bitcoin briefly retraces and touches the previously broken resistance level. This level, which should act as support in an upward trend, fails to hold, and the price quickly drops below it.
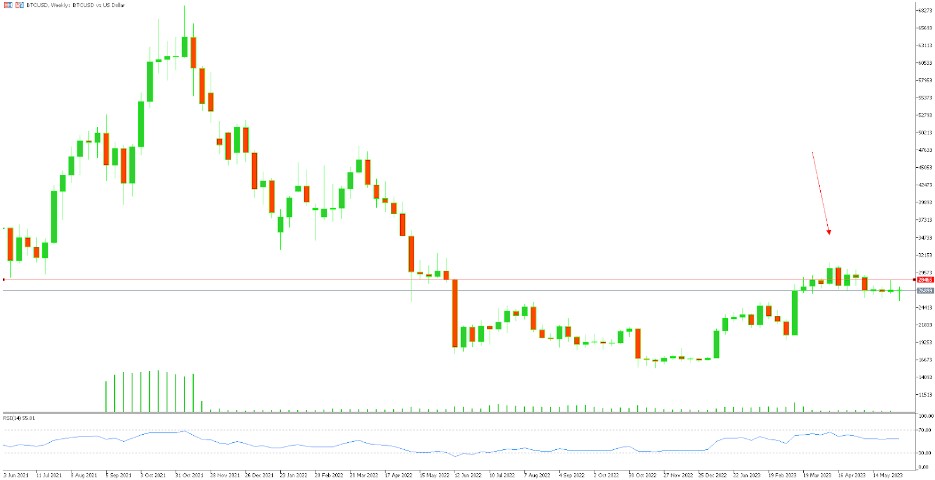
This failure to maintain the support level is a warning sign that the breakout may not be genuine.
2. Divergence in Oscillators
You observe that while the price of Bitcoin is making higher highs, the Relative Strength Index (RSI) or the Moving Average Convergence Divergence (MACD) is showing lower highs or starting to diverge.
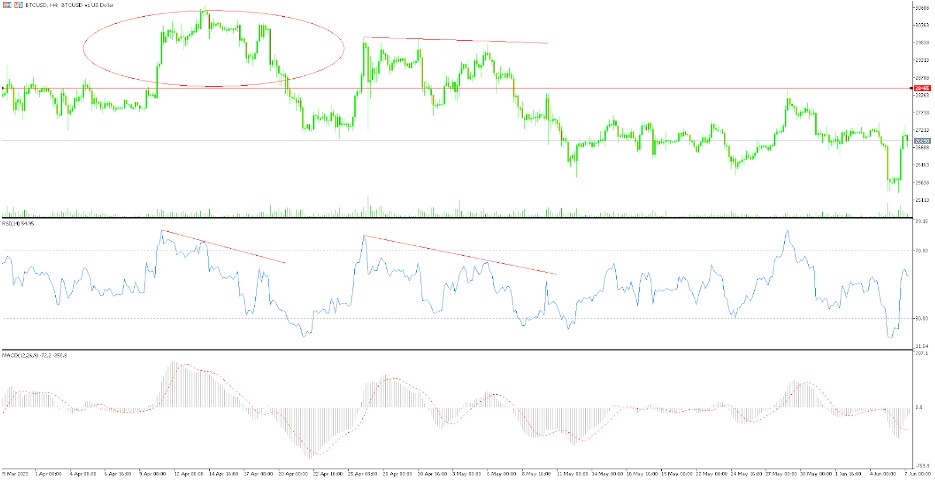
This bearish divergence suggests weakening bullish momentum and raises doubts about the sustainability of the rally.
3. Lack of Volume Confirmation
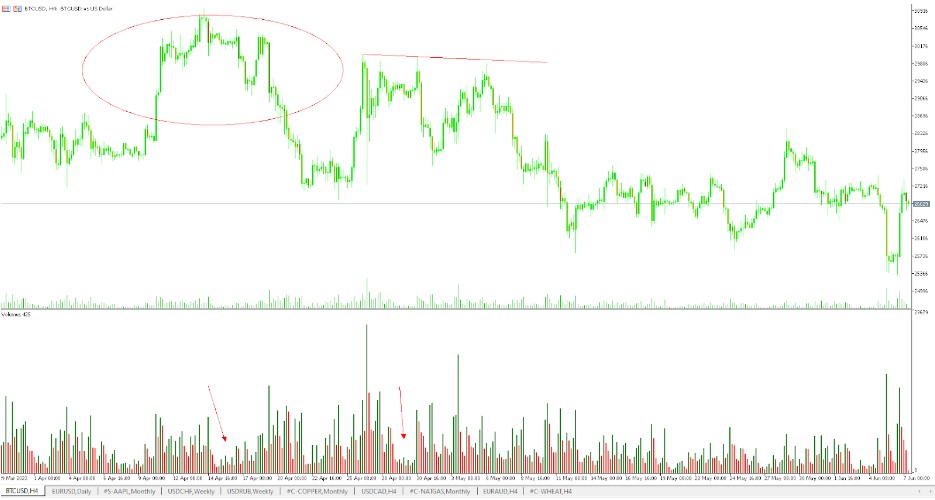
As the price rallies, you notice that the trading volume remains relatively low or fails to increase significantly. Healthy rallies typically exhibit a surge in volume, indicating strong market participation. The lack of substantial volume accompanying the breakout raises concerns about the legitimacy of the upward move.
4. Bearish Candlestick Patterns
During the rally, you spot bearish candlestick patterns, such as a shooting star or a bearish engulfing pattern, forming at key resistance levels. These patterns suggest a potential reversal and indicate that the bears may take control of the market sentiment.
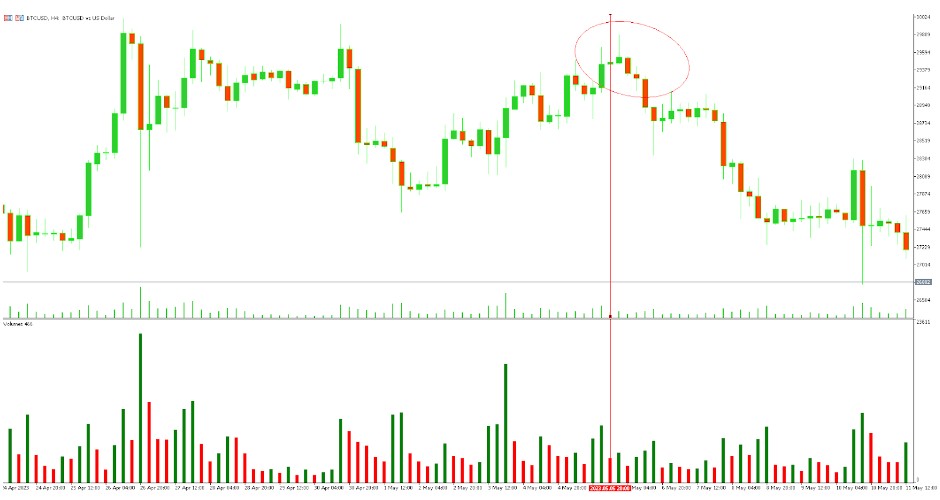
Considering these factors, you become cautious and suspect a bull trap might be at play. Instead of rushing to buy Bitcoin, you exercise patience and wait for more confirmation.
As the days pass, your suspicions are validated. The price of Bitcoin fails to sustain the upward momentum and begins to decline, eventually falling below the previous low points. Traders who entered long positions during the breakout are now trapped in losing trades.
By paying attention to the price action, indicators, volume, and candlestick patterns, you were able to identify the warning signs of a potential bull trap and avoid falling into the trap.
Remember, it’s just an example, so it's essential to conduct your own analysis, utilize various tools and indicators, and exercise proper risk management when making trading decisions.
Bull Trap vs Bear Trap
In the realm of financial markets, both bull traps and bear traps are deceptive price movements that can mislead traders and investors. While they may share some similarities, there are distinct differences between the two. Let's explore bull traps and bear traps individually, along with real-life examples to illustrate their characteristics.
Bull Trap
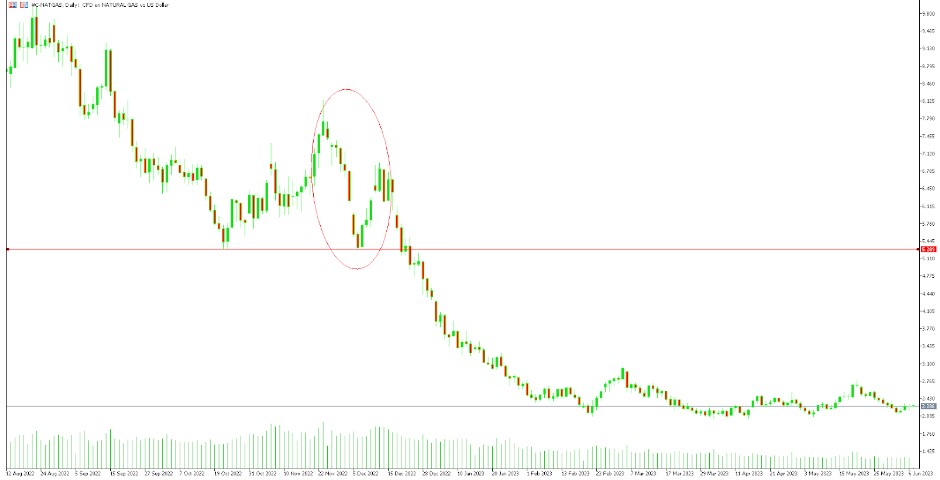
A bull trap occurs when prices temporarily break out above a key resistance level, signaling a bullish trend reversal. This upward move entices traders to enter long positions, expecting further price gains. However, the trap is set when the price swiftly reverses and falls back below the resistance level, catching bullish traders off guard. This sudden reversal often leads to stop-loss orders being triggered, adding to the downward pressure.
Bull Trap Example:
Imagine a stock that has been in a downtrend for a while. It reaches a key resistance level, and the price breaks out above it, triggering a surge of buying interest. Bullish traders interpret this breakout as a signal to enter long positions, expecting a significant uptrend. However, the stock quickly reverses direction, falling back below the resistance level, trapping the bullish traders who entered their positions based on the false breakout.
Bear Trap
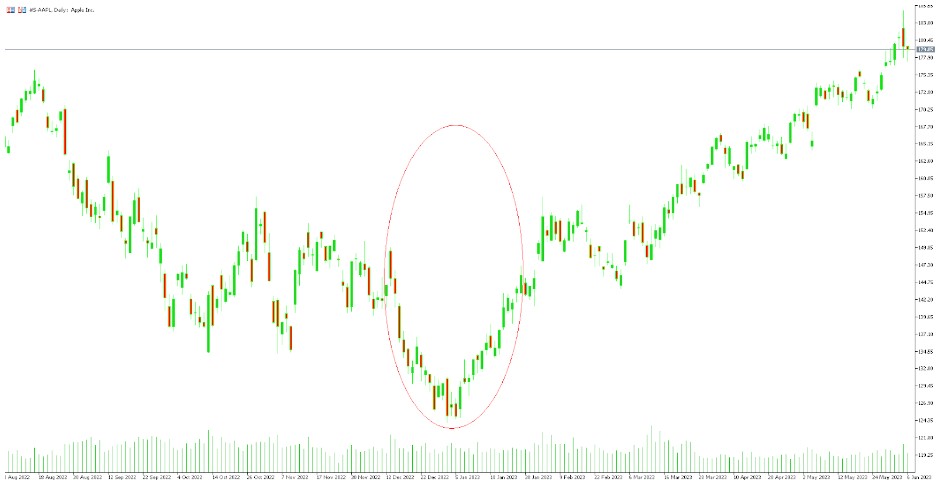
On the other hand, a bear trap occurs when prices temporarily break below a key support level, suggesting a bearish trend reversal. This downward move lures in traders who initiate short positions, anticipating further price declines. However, the trap is set when the price swiftly reverses and rises back above the support level, trapping the bearish traders who now face losses. The sudden reversal often triggers a buying frenzy as short sellers rush to cover their positions.
Bear Trap Example:
Consider a stock that has been in an uptrend for a while. It reaches a critical support level, and the price breaks below it, leading to a wave of selling pressure. Bearish traders interpret this breakdown as a signal to enter short positions, expecting a significant downtrend. However, the stock quickly reverses course, rising back above the support level, trapping the bearish traders who initiated their positions based on the false breakdown.
Bull traps and bear traps are deceptive market movements that can have significant implications for traders. Understanding their characteristics and being able to identify them can help traders avoid potential losses and adjust their strategies accordingly. By studying real-life examples of these traps, market participants can enhance their awareness and decision-making skills when navigating the complexities of financial markets.
The Psychology of Investors in Bulltraps
The psychology of stock market investors in bull traps can be quite fascinating. When investors find themselves caught in a bull trap, several psychological factors come into play:
- Greed and FOMO (Fear of Missing Out): Bull traps often occur during periods of heightened optimism and positive market sentiment. Investors may succumb to the fear of missing out on potential profits and feel the urge to jump on the bandwagon of a perceived upward trend. Greed can cloud their judgment and lead them to overlook potential warning signs or conduct thorough analysis.
- Confirmation Bias: Confirmation bias is a cognitive bias where individuals seek information that confirms their existing beliefs or biases. In the context of bull traps, investors may selectively focus on positive news or technical indicators that support their bullish outlook, ignoring contradictory evidence. This bias can lead to overconfidence and an increased susceptibility to falling into traps.
- Herd Mentality: Investors often look to others for cues on how to act in the market. During a bull trap, when others are entering long positions and expressing optimism, the herd mentality can influence investors to follow suit. They may believe that others possess superior knowledge or insight, leading to a collective behavior that contributes to the trap.
- Loss Aversion: Loss aversion refers to the tendency of individuals to prefer avoiding losses rather than acquiring equivalent gains. When investors find themselves trapped in a bullish position as prices reverse, they may experience a heightened aversion to incurring losses. This aversion can delay their decision to exit the position, in the hope that the market will reverse and recover their losses.
- Anchoring Bias: Anchoring bias occurs when individuals rely too heavily on initial information or reference points when making subsequent decisions. In the context of bull traps, investors may anchor their beliefs to the initial breakout above a resistance level or other positive signals. This bias can prevent them from adjusting their positions or considering new information as the trap unfolds.
It is important for investors to be aware of these psychological tendencies and exercise caution during periods of market exuberance. Conducting thorough research, maintaining a disciplined approach, and being open to alternative viewpoints can help mitigate the impact of bull traps and improve decision-making in the stock market.
Bottom Line on What is a Bull Trap
So what we have learned:
- Bull traps are deceptive price movements that can ensnare even the most astute investors. These traps occur when prices momentarily break out above a resistance level, luring in bullish traders, only to swiftly reverse and fall back below the resistance level.
- The psychology of investors in bull traps reveals the influence of greed, confirmation bias, herd mentality, loss aversion, and anchoring bias, all of which can cloud judgment and lead to poor decision-making.
To navigate bull traps successfully, it is important for you to remain vigilant and employ effective risk management strategies. Recognizing the warning signs, such as failed support levels, divergences in indicators, lack of volume confirmation, and bearish candlestick patterns, can help avoid falling into these traps. Additionally, understanding the differences between bull traps and bear traps and studying real-life examples can enhance market awareness and decision-making skills.
By cultivating a disciplined and objective approach, conducting thorough research, and considering alternative viewpoints, investors can better protect themselves from the psychological pitfalls associated with bull traps.
Remember, the market can be full of surprises, but with a keen eye and a cautious mindset, traders can navigate these traps and stay one step ahead in the dynamic world of financial markets.

