- Education
- Introduction to Trading
- Most Successful Chart Patterns
Most Successful Chart Patterns
Forex chart patterns are graphical representations of price movements that can help you identify trends, reversals, and trading opportunities. Chart patterns can be classified into two types:
- continuation
- and reversal.

Continuation patterns indicate that the existing trend is likely to resume, while reversal patterns signal that the trend is likely to change direction.
In this article, we will explore some of the best trading patterns that can help you improve your forex trading skills and results. We will explain what each pattern looks like, how to trade it, and what to watch out for. We will also provide some examples and images of each pattern to help you visualize them.
Best Trading Patterns
- Ascending Triangle
- Descending Triangle
- Symmetric Triangle
- Bullish Rectangle
- Bearish Rectangle
- Forex Flag
- Pennant Pattern
- Wedge Pattern
- Head and Shoulders
- Inverse Head and Shoulders
- Double Top Pattern
- Double Bottom Pattern
- Triple Top Pattern
- Triple Bottom Pattern
- Forex Diamond
Ascending Triangle
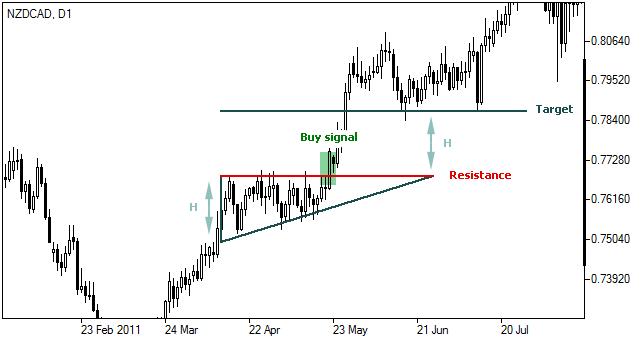
An ascending triangle is a bullish continuation pattern that forms when the price makes higher lows and a horizontal resistance level. The pattern indicates that the buyers are gradually gaining control over the sellers, and that a breakout above the resistance is likely.
To trade an ascending triangle, you can look for a strong volume surge and a candlestick close above the resistance level. You can then enter a long position and set your stop loss below the most recent low. You can also use the height of the triangle as a target for your profit.
Descending Triangle
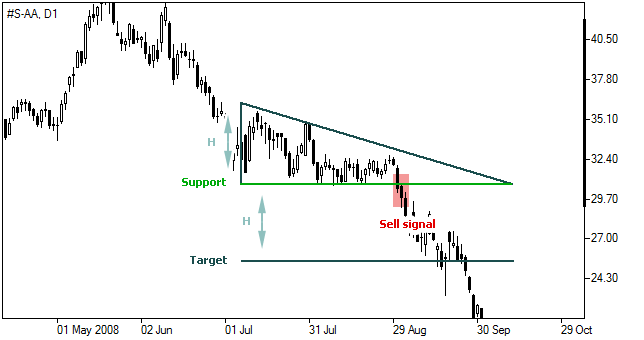
A descending triangle is a bearish continuation pattern that forms when the price makes lower highs and a horizontal support level. The pattern indicates that the sellers are gradually gaining control over the buyers, and that a breakdown below the support is likely.
To trade a descending triangle, you can look for a strong volume surge and a candlestick close below the support level. You can then enter a short position and set your stop loss above the most recent high. You can also use the height of the triangle as a target for your profit.
Symmetric Triangle
A symmetric triangle is a neutral continuation pattern that forms when the price makes lower highs and higher lows, creating a narrowing range. The pattern indicates that the market is in a state of indecision, and that a breakout in either direction is possible.
To trade a symmetric triangle, you can wait for a clear break and close above or below the triangle boundaries. You can then enter a long or short position depending on the direction of the breakout, and set your stop loss on the opposite side of the triangle. You can also use the width of the triangle as a target for your profit.

Bullish Rectangle
A bullish rectangle is a bullish continuation pattern that forms when the price consolidates within a horizontal range after an uptrend. The pattern indicates that the buyers are taking a pause before resuming the uptrend, and that the price is likely to break out above the resistance level.
To trade a bullish rectangle, you can look for a strong volume surge and a candlestick close above the resistance level. You can then enter a long position and set your stop loss below the support level. You can also use the height of the rectangle as a target for your profit.

Bearish Rectangle
A bearish rectangle is a bearish continuation pattern that forms when the price consolidates within a horizontal range after a downtrend. The pattern indicates that the sellers are taking a pause before resuming the downtrend, and that the price is likely to break out below the support level.
To trade a bearish rectangle, you can look for a strong volume surge and a candlestick close below the support level. You can then enter a short position and set your stop loss above the resistance level. You can also use the height of the rectangle as a target for your profit.

Forex Flag
A forex flag is a bullish or bearish continuation pattern that forms when the price makes a sharp move in one direction, followed by a small consolidation in a parallel channel. The pattern resembles a flag on a pole, and indicates that the price is likely to continue in the direction of the initial move.
To trade a forex flag, you can measure the length of the pole and project it from the point of the breakout. You can then enter a long or short position depending on the direction of the flag, and set your stop loss on the opposite side of the channel. You can also use the projected length of the pole as a target for your profit.

Pennant Pattern
A pennant is a bullish or bearish continuation pattern that forms when the price makes a sharp move in one direction, followed by a small consolidation in a converging channel. The pattern resembles a triangular flag on a pole, and indicates that the price is likely to continue in the direction of the initial move.
To trade a pennant, you can measure the length of the pole and project it from the point of the breakout. You can then enter a long or short position depending on the direction of the pennant, and set your stop loss on the opposite side of the channel. You can also use the projected length of the pole as a target for your profit.

Wedge Pattern
A wedge is a reversal or continuation pattern that forms when the price moves within a narrowing range, creating a converging trend line. The pattern can be either rising or falling, depending on the slope of the trend line. A rising wedge is bearish, while a falling wedge is bullish.
To trade a wedge, you can wait for a clear break and close above or below the trend line. You can then enter a long or short position depending on the direction of the breakout, and set your stop loss on the opposite side of the wedge. You can also use the width of the wedge as a target for your profit.

Head and Shoulders
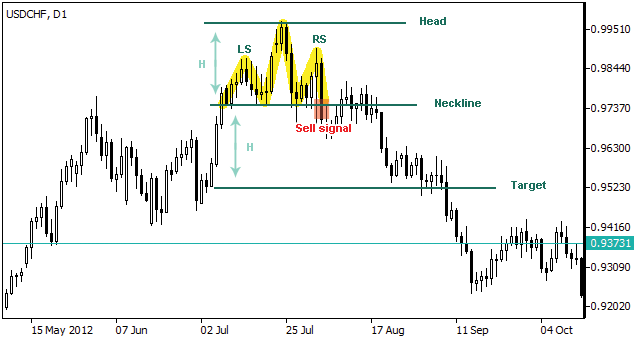
A head and shoulders is a bearish reversal pattern that forms when the price makes three peaks, with the middle peak being the highest. The pattern resembles a human head and shoulders, and indicates that the uptrend is losing momentum and that a downtrend is likely to follow.
To trade a head and shoulders, you can draw a horizontal line connecting the lows of the two shoulders, called the neckline. You can then look for a strong volume surge and a candlestick close below the neckline. You can then enter a short position and set your stop loss above the right shoulder. You can also use the distance between the head and the neckline as a target for your profit.
Inverse Head and Shoulders
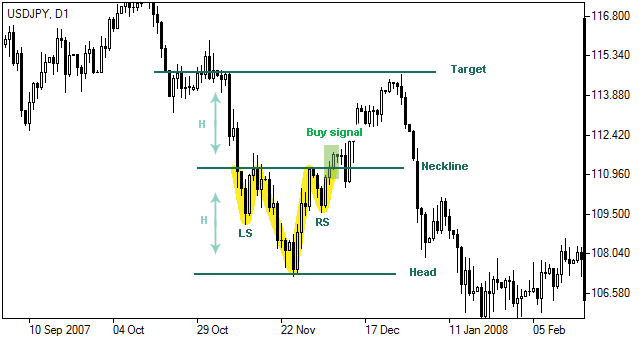
An inverse head and shoulders is a bullish reversal pattern that forms when the price makes three troughs, with the middle trough being the lowest. The pattern resembles an inverted human head and shoulders, and indicates that the downtrend is losing momentum and that an uptrend is likely to follow.
To trade an inverse head and shoulders, you can draw a horizontal line connecting the highs of the two shoulders, called the neckline. You can then look for a strong volume surge and a candlestick close above the neckline. You can then enter a long position and set your stop loss below the right shoulder. You can also use the distance between the head and the neckline as a target for your profit.
Double Top Pattern
A double top is a bearish reversal pattern that forms when the price makes two peaks at roughly the same level, separated by a moderate trough. The pattern indicates that the price is facing strong resistance and that a downtrend is likely to follow.
To trade a double top, you can draw a horizontal line connecting the lows of the two peaks, called the neckline. You can then look for a strong volume surge and a candlestick close below the neckline. You can then enter a short position and set your stop loss above the second peak. You can also use the distance between the peaks and the neckline as a target for your profit.

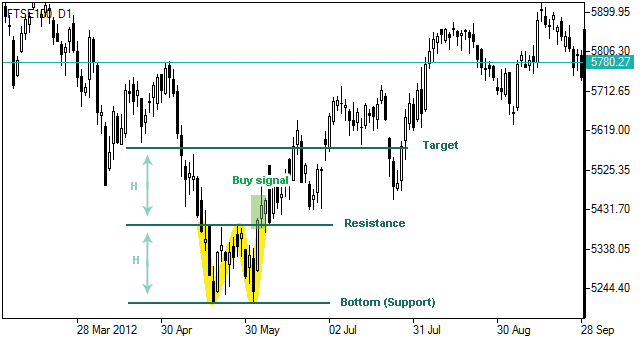
Double Bottom Pattern
A double bottom is a bullish reversal pattern that forms when the price makes two troughs at roughly the same level, separated by a moderate peak. The pattern indicates that the price is facing strong support and that an uptrend is likely to follow.
To trade a double bottom, you can draw a horizontal line connecting the highs of the two troughs, called the neckline. You can then look for a strong volume surge and a candlestick close above the neckline. You can then enter a long position and set your stop loss below the second trough. You can also use the distance between the troughs and the neckline as a target for your profit.
Triple Top Pattern
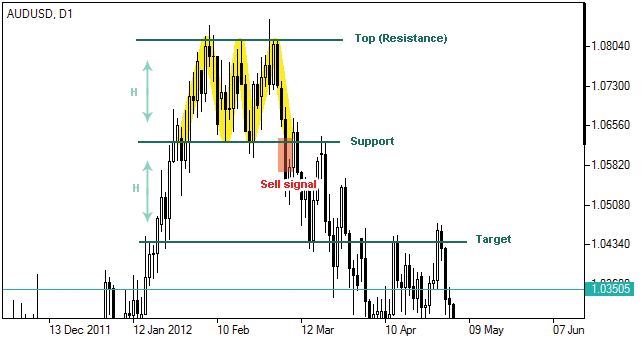
A triple top is a bearish reversal pattern that forms when the price makes three peaks at roughly the same level, separated by moderate troughs. The pattern indicates that the price is facing strong resistance and that a downtrend is likely to follow.
To trade a triple top, you can draw a horizontal line connecting the lows of the three peaks, called the neckline.
You can then look for a strong volume surge and a candlestick close below the neckline. You can then enter a short position and set your stop loss above the third peak. You can also use the distance between the peaks and the neckline as a target for your profit.
Triple Bottom Pattern
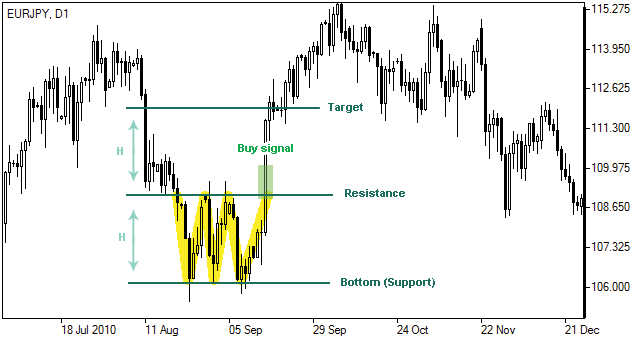
A triple bottom is a bullish reversal pattern that forms when the price makes three troughs at roughly the same level, separated by moderate peaks. The pattern indicates that the price is facing strong support and that an uptrend is likely to follow.
To trade a triple bottom, you can draw a horizontal line connecting the highs of the three troughs, called the neckline. You can then look for a strong volume surge and a candlestick close above the neckline. You can then enter a long position and set your stop loss below the third trough. You can also use the distance between the troughs and the neckline as a target for your profit.
Forex Diamond
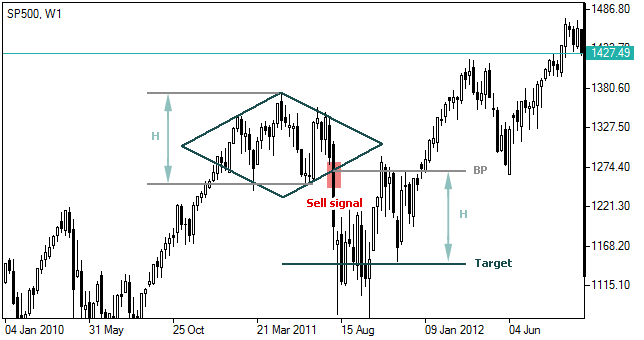
A forex diamond is a rare reversal pattern that forms when the price makes a broadening formation followed by a narrowing formation. The pattern resembles a diamond shape, and indicates that the price is undergoing a major shift in trend direction.
To trade a forex diamond, you can draw two diagonal lines connecting the highs and lows of the broadening and narrowing formations, creating a diamond shape. You can then wait for a clear break and close above or below the diamond boundaries.
You can then enter a long or short position depending on the direction of the breakout, and set your stop loss on the opposite side of the diamond. You can also use the width of the diamond as a target for your profit.
Types of Chart Patterns
As we mentioned earlier, chart patterns can be classified into two types: continuation and reversal. Continuation patterns indicate that the existing trend is likely to resume after a brief pause or consolidation. Reversal patterns signal that the trend is likely to change direction after a prolonged or significant move.
Some of the common continuation patterns are:
- Triangles (ascending, descending, and symmetric)
- Rectangles (bullish and bearish)
- Flags and pennants
- Wedges (rising and falling)
Some of the common reversal patterns are:
- Head and shoulders and inverse head and shoulders
- Double tops and bottoms
- Triple tops and bottoms
- Diamonds
Conclusion
Chart patterns are powerful tools that can help traders identify trends, reversals, and trading opportunities. By learning how to recognize and trade these patterns, you can improve your forex trading skills and results.
However, chart patterns are not foolproof, and they should be used in conjunction with other technical indicators, such as volume, support and resistance, and trend lines. You should also always use proper risk management and follow your trading plan.
Good Luck!

