- Education
- Forex Trading Strategies
- Trading Styles Strategies
- Forex Day Trading Strategies
- Daily Pivot Trading Strategy
Daily Pivot Trading Strategy - How to Calculate Pivot Points
A pivot point trading strategy is a trader's best friend when it comes to identifying levels to develop a bias, place stops and identify potential profit targets for a trade. Pivot points are used by traders on stock and commodity exchanges. They are calculated based on the highs, lows and close prices of previous trading sessions and are used to predict support and resistance levels in the current or upcoming session. Support and resistance levels can be used by traders to determine entry and exit points for both stop losses and profit taking.
KEY TAKEAWAYS
- The pivot point is an average of the high, low and closing prices from the previous trading day.
- The success of the pivot point system depends on the trader and his ability to effectively use it in conjunction with other forms of technical analysis.
- Traders calculate pivot points to set the levels of stops, entry and profit taking.
Pivot Points Trading Strategy
As we mentioned earlier pivot points strategy could very well be traders best friend when identifying levels to develop a bias, place stops and identify potential profit targets for a trade. Before we start, if you are new to trading, it is best to start with the basics, “What is Forex trading”.
Pivot points can be used in trading to help assess upward and downward trends and determine the best points to enter or exit a trade.
Traders can use the pivot point indicator for a wide variety of financial markets such as indices, stocks, and generally Forex trading.
Here are a few Pivot Points Trading Strategies that can be used:
- Pivot Points Trend Trading Strategy - Traders can use pivot points for trend trading, using them when calculating support and resistance. The idea is that after the price has chosen the direction based on the pivot point, the trader can take advantage of corrections at significant levels. If price convincingly breaks through the first support or resistance level and then pulls back, the trader can buy or sell on the bounce off that resistance level.

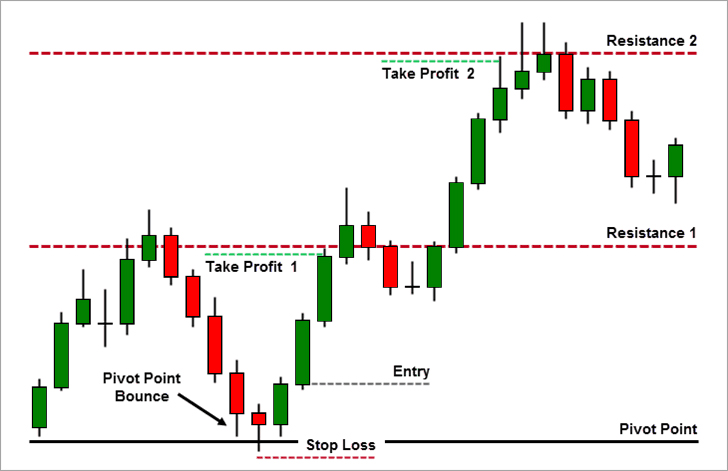
- Pivot Point Bounce Strategy - The pivot point bounce is an ideal trading strategy. The idea is that if the price is above the pivot point, the market sentiment is bullish. If the price is below the pivot point, the market sentiment is bearish. The pivot point bounce takes advantage of market sentiment - buying or selling if price retraces back to the pivot point, which is a good horizontal support or resistance level.

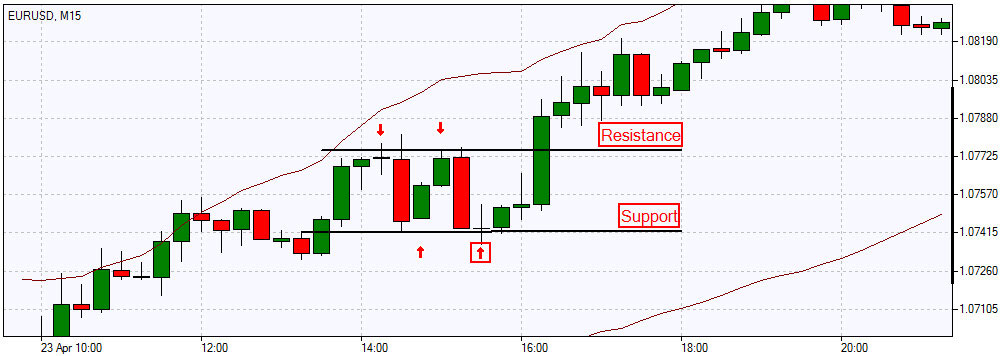
- Pivot points intraday trading - Pivot points are mostly used by day traders, on 10, 15 and hourly charts. Regardless of the timeframe used, the pivot levels stay the same as they are based on a mathematical formula for the prior day’s high, low and close. Chart time frames only show price action detail occurring around the pivot point indicator levels. For example, here is an hourly chart of the EUR/USD currency pair. The grey line in the middle represents the pivot point, with the S1, S2, and S3 below and the R1, R2, and R3 above. That can be easily seen on the chart.
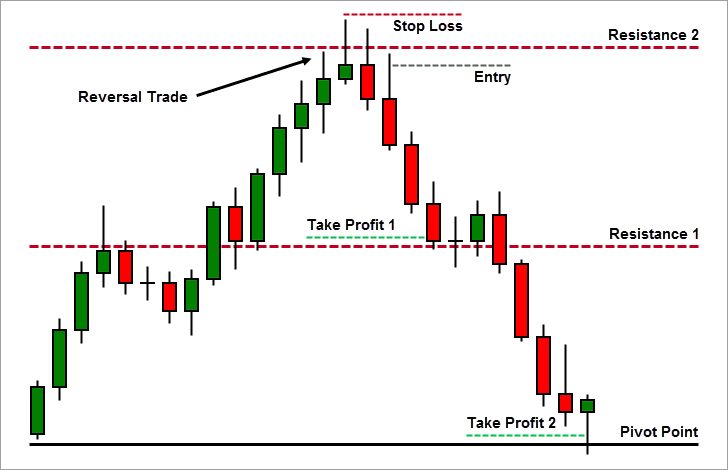
- Pivot Point Reversal Strategy - Support and resistance levels calculated through pivot points can be used for reversal trades as well. If price is slowing down near the second or third support or resistance levels - it’s a good place to buy or sell respectively. The idea is that at support or resistance levels 1 and 2, the price is likely to expand. Since these levels are also usually good horizontal support and resistance levels, they are excellent areas to look for reversal trades.

Pivot Points in Forex - The Forex market is open 24 hours a day during the week. The official forex trading day begins and ends at 5:00 pm Eastern Standard Time (EST) at the end of the US trading session. Pivot points are calculated based on the highs and lows of the entire 24-hour period, and the close at the end of the American session is used in most pivot point calculators. Sometimes levels are not always relevant for traders who only trade during the London or American session. They trade only a small portion of the day, but use an indicator based on 24-hour price movement.
Pivot points can also be applied based on four-hour or hourly highs, lows and closing prices. Traders can add pivot points to their price chart and change the indicator timeframe. This will provide more potential areas for observation over a 24-hour period. During this 24 hour period, six sets of control points are generated. This can provide more potential trades or better understanding, in particular for day forex traders.
How to Trade Using Pivot Points
The pivot point is an average of the high, low and closing prices from the previous trading day.
Pivot points can be used in two ways.
- To determine the general trend of the market. If the price of the pivot point breaks out in an upward movement, then the market is bullish. If the price falls below the pivot point, then this is a bearish move.
- Pivot price levels are used to enter and exit the market. Let's say a trader wants to place a limit order to buy 100 shares if the price breaks the resistance level. Alternatively, the trader can set a stop loss at or near the support level.
Remember only relying on one indicator in case of pivot points won’t do good for your profits.
The success of the pivot point system depends on the trader and his ability to effectively use it in conjunction with other forms of technical analysis. Other technical indicators can be; MACD to candlestick patterns, or use a moving average to help establish trend direction. The greater the number of positive indications of a trade, the greater the chances of success.
What are Pivot Points
The pivot point is an average of the intraday high and low, and the closing price from the previous trading day. It's a technical analysis indicator traders use to identify market trend over different time frames. Trading on the next day above the pivot point is indicating bullish sentiment and below the pivot point - bearish sentiment. Pivot Point is the basis indicator, but also participates in constructing Support and Resistance levels as well.
When pivot points are used in conjunction with other technical analysis tools, and can help traders improve their trades profitability.
Pivot points can be calculated on weekly bases used by swing traders, monthly bases which are used by position traders. These are used to estimate upcoming support and resistance levels.
However, pivot points are predictive tools, they don't hold 100% accuracy, therefore there is a chance of mistake. There are some limitations to pivot points; they are based on a simple calculation and there are no assurances that the price will stop, reach the levels on the chart or reverse. Some traders are well versed and know when to trust the trend and when not to. Sometimes price can move back and forth, it is advised to pivot points as any other indicators in a trading plan.
For example pivot points can be combined with Moving Average (50, 200) or Fibonacci extension level, in this case support and resistance level becomes a stronger, more reliable.
How to Calculate Pivot Points
Pivot point indicators can be added to a chart and it will automatically create levels and show it. Keep in mind that pivot points are calculated from highs, lows and closing price from the prior day.
So if the trader needs to create pivot points levels for today, he/she would need to
- High indicates - the highest price from the prior trading day,
- Low indicates - the lowest price from the prior trading day,
- Close indicates - the closing price from the prior trading day.
- Sum the high, low, and close and then divide by three.
- Mark the prize as P on the chart
- When P (price) is known, traders would need to calculate Support1 and 2 as well as resistance1 and 2.
Traders calculate pivot points to set the levels of stops, entry and profit taking. Most common way of calculating pivot point is a 5 point system.
The Formula for Pivot Points:
P = (H + L + C)/3
Pivot Point = (Previous High + Previous Low + Previous Close) / 3
R1 = (P x 2) – L
S1 = (P x 2) – H
R2 = P + (H - L) = P + (R1 - S1)
S2 = P - (H - L) = P - (R1 - S1)
where:
P - Pivot Point
L - Previous Low
H - Previous High
R1 - Resistance Level 1
S1 - Support Level 1
R2 - Resistance Level 2
S2 - Support Level 2
High indicates - the highest price from the prior trading day,
Low indicates - the lowest price from the prior trading day,
Close indicates - the closing price from the prior trading day.
Bottom Line on Pivot Trading Strategy
Pivots provide an excellent opportunity to identify areas of support and resistance, but they work best in conjunction with other types of technical analysis.
Pivot points are based on a simple calculation - an average of the high, low and closing prices from the previous trading day. There is no guarantee that the price will stop, reverse, or even reach the levels created on the chart. In other cases, the price will move back and forth through the level. Like all indicators, it should only be used as part of a complete trading plan.
The major benefit of pivot points is they work on all the financial markets and also on all the trading time frames. Traders should try not to use this indicator in the ranging conditions and also avoid the use in the highly volatile markets.
NEW TO TRADING OR WANT TO
IMPROVE YOUR LEVEL?
Check out our Trading Academy with
professional video lessons
and articles.

