- नवाचार
- PCI के आवेदन पर लेख
- नए अवसर
Profiting in bear and bull oil markets
Oil Global Trend
- Oil prices slumped since 2014; Brent: -64%
- Stock prices of major oil companies are correlated with oil but declines were smaller
Oil prices have been falling since June 2014 as increasing supply of crude oil by major producers exceeded global demand for the commodity. Brent crude oil prices are down by more than 64% since June 20, 2014 causing great strain for oil producers who have to repay debts taken when no such downturn was expected. US oil rig count fell by 703 since March 2015 as lower prices led to falling earnings. Since the start of 2015 more than 40 US energy companies have declared bankruptcy.
Energy Information Administration estimates in its March, 2016 monthly report that the US shale oil output will fall 106,000 barrels-per-day (bpd) in April from March to total 4.871 million bpd. Major oil producers Saudi Arabia, Russia, Qatar and Venezuela agreed last month to freeze crude oil output at January levels in an attempt to stem the global glut but on condition other producers will join the agreement.
Oil prices have reversed after that on expectations that rising demand will clear the global overhang of stockpiles with output kept steady. Data from China's General Administration of Customs seem to support this expectations at least for the world's second largest oil consumer: China’s crude oil imports in February jumped 20% year over year to 8.0 million barrels per day, to highest ever on a daily basis.
While the recent advance in prices has resulted in more than 7% gain in Brent crude price year-to-date, many analysts have rightfully noted that the oil market is still oversupplied and prices have to remain lower to help rebalance the market, as supplies fall. Increasing output by Iran is a major factor which may contribute to continued downward pressure on prices as Iran increases its crude oil output to pre-sanction level of 4 million bpd and ramps up its exports to regain lost market share as Tehran has said repeatedly it intends to do.
Stock prices of major energy companies are correlated with crude oil: they change as crude oil prices fluctuate but over time these changes are usually smaller than fluctuations in oil prices. This is largely the result of integrated business model of major energy companies with operations involving both upstream exploration and production of crude oil, as well as downstream refining of crude oil and marketing of refined oil products.
Brent vs. Oil Companies: Comparison
During last 3 years Brent oil decline is sharper than major oil companies. Therefore, comparing oil companies stocks vs. Brent oil trends we can explore interesting trading strategies
Such an integrated model makes earnings less sensitive to changes in crude oil prices: while earnings from crude oil sale fall as oil prices fall, with falling input costs earnings from refining business units rise helping to compensate partially for declining upstream earnings. Thus stock prices of major energy companies tend to fall less for a given decline in oil prices and tend to advance less than a given rise in underlying oil prices. A comparison of asset performances in the table below verifies that changes in stock prices of major oil companies – Exxon Mobil (XOM), Chevron (CVX) and BP (BP) were smaller in magnitude than changes in underlying oil prices in recent periods.
| Period | Brent Price Change, % | XOM Price Change, % | CVX Price Change,% | BP Price Change, % |
| June 20, 2014 - January 14, 2015 | -56.54 | -13.63 | -21.51 | -32.41 |
| January 14, 2015 - May 6, 2015 | +34.87 | -2.01 | +2.07 | +18.76 |
| May 6, 2015 - August 24, 2015 | -36.52 | -21.53 | -32.19 | -26.01 |
| August 24, 2015 - January 20, 2016 | -37.44 | +4.04 | +7.42 | -9.92 |
A trading strategy of combining long and short positions in stocks of major oil companies and oil can be employed to take advantage of differences in rates of change of these instrument prices. In essence this strategy of taking opposite positions in oil and stocks of major energy companies is similar to pairs trading. For example, in the first period from June 20, 2014 to January 14, 2015 the profitable trading strategy would be taking a short position in Brent oil and long position in any of the major energy company stocks. In the second period from January 14, 2015 to May 6, 2015 going long in Brent oil and short in any of three stocks would be the winning strategy. And in the next two periods of falling oil prices shorting the Brent oil again and going long in stocks would generate positive returns.
New Synthetic Instrument (PCI): &XOM_ Brent
- &XOM/ Brent = 123 shares of Exxon Mobil, and a Quote portfolio made up of 274 barrels of Brent crude oil
- &XOM/ Brent PCI trend goes up when Brent oil trend goes down
The Personal Composite Instrument (PCI) technology developed by the IFC Markets based on Portfolio Quoting Method is the perfect instrument for studying the relative performance of oil and major energy company stocks, and implementing appropriate trading strategy. Investors can create unlimited numbers of new financial instruments – PCIs, by combining assets from various markets and asset classes to test their investment ideas using the proprietary NetTradeX platform of IFC Markets. A PCI with one of the stocks of major energy companies as the Base portfolio and the Brent oil as the Quote portfolio can be created. For details on how to create PCIs using the innovative Portfolio Quoting Method follow the link “How to create PCI”.
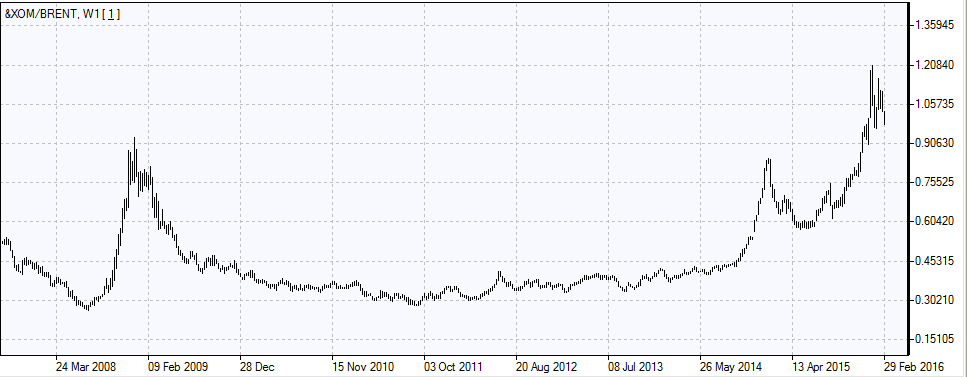
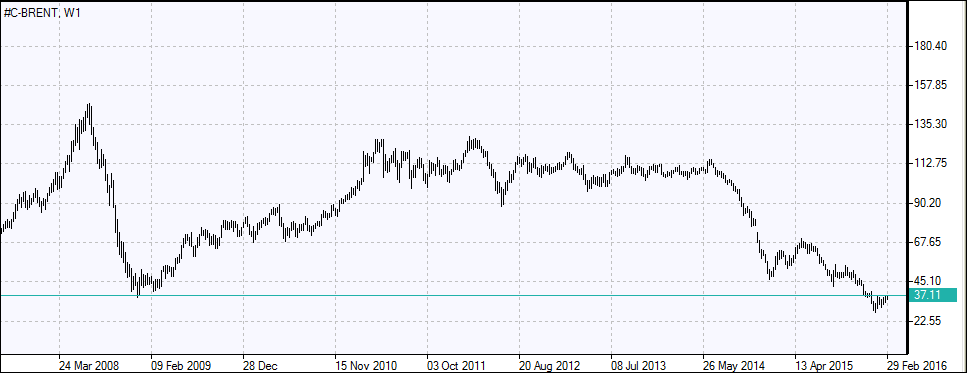
We have set the structure of the PCI as a Base portfolio composed of 123 shares of Exxon Mobil, and a Quote portfolio made up of 274 barrels of Brent crude oil. The PCI has been named &XOM_Brent, and the chart of the newly created instrument is displayed in Figure 1. The chart of the Brent crude oil price is presented in Figure 2 for a reference.


To understand what the PCI chart is telling about the relative performance of the Exxon Mobil stock and Brent crude oil it should be noted that the price of our PCI is equal to the ratio of the dollar values of 123 shares of Exxon Mobil and 274 barrels of Brent crude oil. The charts look like the inverse version of each other: while Brent fell steeply in summer-winter period of 2008 the PCI rose sharply. And as Brent rebounded in 2009-2010 period the PCI fell. This means that Exxon Mobil stock, which is in the numerator for the PCI price ratio, fell less in summer-winter period of 2008 than Brent. And in the subsequent period as Brent rebounded Exxon Mobil stock recorded smaller gains. This pattern allows to trade two assets by taking opposite positions in them, which is what our PCI allows to do.
IFC बाजार द्वारा विशेष रूप से की पेशकश PCI उपकरणों व्यापार के लिए, आप एक नि: शुल्क खाता खोलने और NetTradeX मंच डाउनलोड करने की जरूरत है
&XOM_ Brent Trend
- The overall signal (confirmed by RSI, MACD, Parabolic Indicators and head-and-shoulder chart pattern) is bearish which is indicated by the red down-arrow on the PCI chart.
- We can go short on the PCI right away by placing a limit order to sell with an entry point below the support line.
- Sell the PCI, which will result in selling the Exxon Mobil stock and buying the Brent crude oil
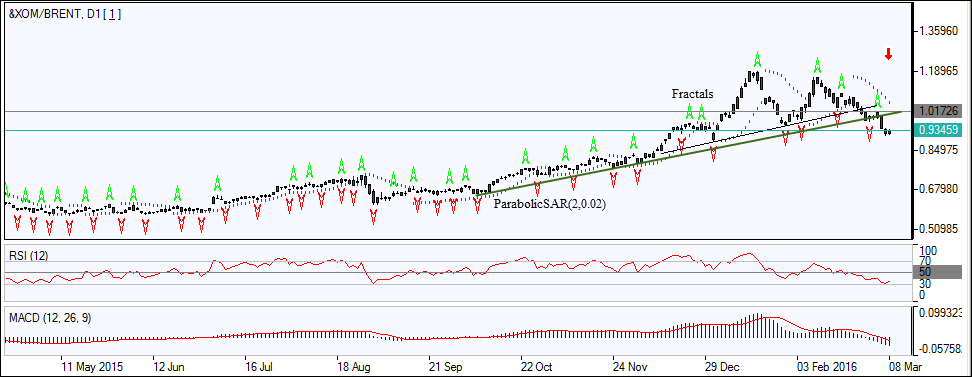
We can use the analytical tools of NetTradeX platform to conduct a technical analysis of the &XOM_Brent PCI chart for trading signals. Let us have a look at the daily candlestick chart of &XOM_Brent below in the Figure 3.

The PCI price had been rising since May 2015, hit the highest in mid-January 2016 and is retracing lower since then. It breached below the neckline of the head-and-shoulder chart pattern formed in the last three months. This is a bearish development. The price has breached the support line of the uptrend and closed below it, which is clearly a bearish development. The RSI indicator has reached the oversold zone and is edging up. The MACD signal line has breached below the zero level, the indicator is below the signal line, and the gap with the signal line is widening. This is also a bearish signal. The Parabolic indicator also gives a sell signal. The overall signal is bearish which is indicated by the red down-arrow on the PCI chart. We can go short on the PCI right away by placing a limit order to sell with an entry point below the support line, and limit the risk by placing the stop loss above last fractal high at 1.0172. The result of the &XOM_Brent PCI technical analysis is straightforward: sell the PCI, which will result in selling the Exxon Mobil stock and buying the Brent crude oil, just what would be expected when oil prices were trending upward.
Similar analyses can be conducted for PCIs made up of any other energy stock as the PCI Base asset paired with the Brent crude oil as the Quote asset. A slightly complex PCI with a combination of major energy stocks as the Base portfolio and the Brent oil as the Quote portfolio can also be constructed and analyzed for trading.
The versatile PCI technology, which allows comparing the relative performance of various assets (from same as well as different asset classes) by pairing them as the Base and Quote portfolios of the PCI, can be used to test ideas for trading strategies for other assets with similar correlation patterns. All is needed is to construct corresponding PCIs through straightforward steps for creation of the PCIs described at the webpage above, and check if the resulting PCIs display appropriate trending behavior.
पिछले लेख
- विनिमय दर और निर्माण के नए वित्तीय साधनों इसके आधार पर
- मुद्रा सूचकांक: केंद्रीय बैंकों की रहस्य अनावरण
- जोड़ी के साथ प्रतिलोम स्प्रेड: ट्रेडिंग: 3 चरणों को समझने के लिए
- पोर्टफोलियो ट्रेडिंग पद्धति - ट्रेडिंग उपकरण की रेंज का विस्तार करना
- पोर्टफोलियो उद्धरण विधि - वित्तीय बाजारों के विश्लेषण के लिए नए तरीके
- पोर्टफोलियो उद्धरण विधि - नई ट्रेडिंग रणनीतियाँ
