- Analytics
- Technical Analysis
Germany 30 Technical Analysis - Germany 30 Trading: 2017-12-01
Accelerating growth is bullish for German Index DE 30
Accelerating manufacturing sector expansion and inflation is bullish for German stock market. Will DE 30 continue rallying?
Euro-zone November inflation edged up to 1.5% from 1.4% in October. While the reading missed the 1.6% forecast, the jobless rate slid to 8.8% in October, the lowest in almost nine years. And economic sentiment continued to improve in November, with euro-zone economic sentiment index hitting the highest level since October 2000. Against this background German jobless claims dropped by more than expected in November while the unemployment rate stayed at a record low 5.6%. And the German inflation gain to 1.8% from 1.6% in October was better than expected, with manufacturing sector expansion accelerating in November as evidenced by Markit Manufacturing PMI’s jump to 62.5 from 60.6 in October. Improving euro-zone and German economic performance are bullish for German stock index DE 30.
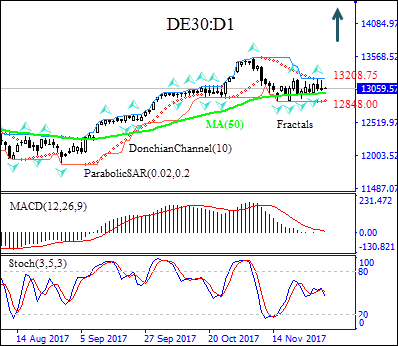
On the daily timeframe DE 30: D1 has been retracing after hitting correction following an all-time high three weeks ago. The price is above the 50-day moving average MA(50).
- The Donchian channel indicates no uptrend yet: it is flat.
- The Parabolic indicator has formed a buy signal.
- The MACD indicator is bullish: it is above the signal line and the gap is widening.
- The stochastic oscillator is falling but hasn’t reached the oversold zone.
We believe the bullish momentum will continue after the price closes above the upper boundary of Donchian channel at 13208.75. This level can be used as an entry point for placing a pending order to buy. The stop loss can be placed below the lower Donchian bound at 12848.00. After placing the order, the stop loss is to be moved every day to the next fractal low, following Parabolic signals. Thus, we are changing the probable profit/loss ratio to the breakeven point. If the price meets the stop loss level (12848.00) without reaching the order (13208.75), we recommend cancelling the position: the market has undergone internal changes which were not taken into account.
Technical Analysis Summary
| Position | Buy |
| Buy stop | Above 13208.75 |
| Stop loss | Below 12848.00 |
- Get Certificate

Note:
This overview has an informative and tutorial character and is published for free. All the data, included in the overview, are received from public sources, recognized as more or less reliable. Moreover, there is no guarantee that the indicated information is full and precise. Overviews are not updated. The whole information in each overview, including opinion, indicators, charts and anything else, is provided only for familiarization purposes and is not financial advice or а recommendation. The whole text and its any part, as well as the charts cannot be considered as an offer to make a deal with any asset. IFC Markets and its employees under any circumstances are not liable for any action taken by someone else during or after reading the overview.
