- एनालिटिक्स
- टेक्निकल एनालिसिस
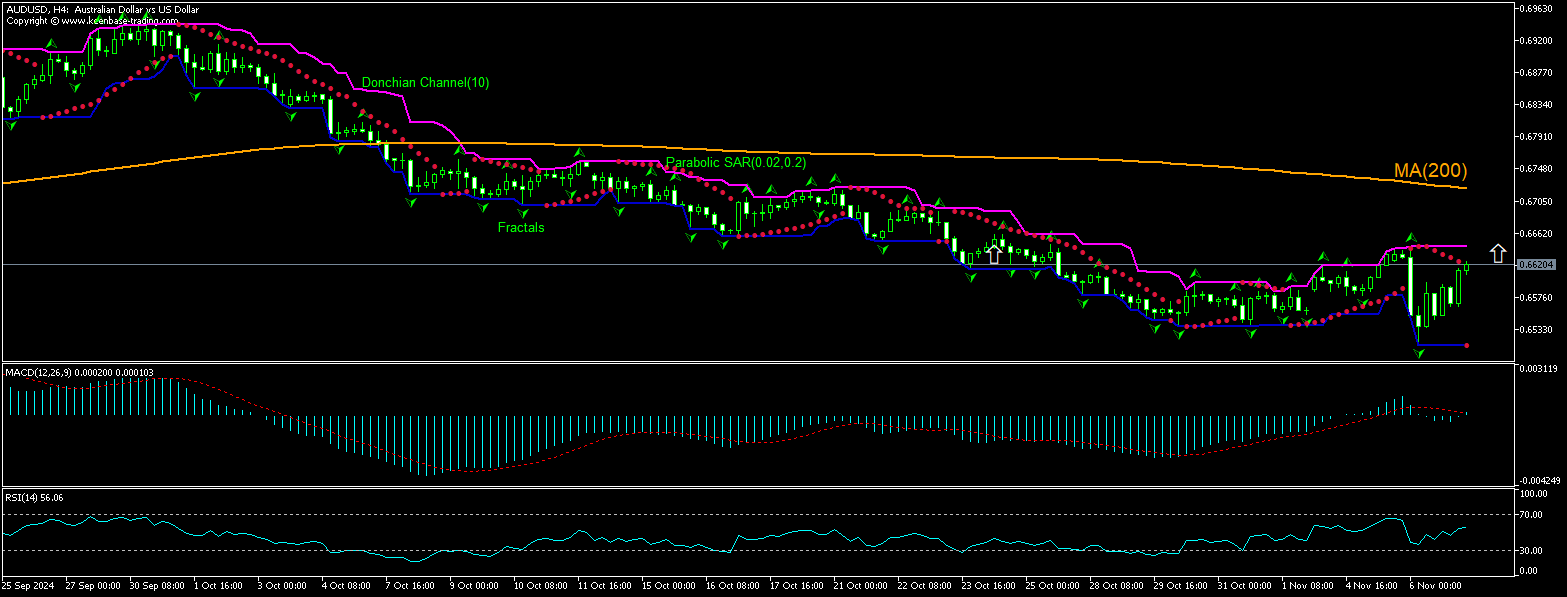
AUD/USD तकनीकी विश्लेषण - AUD/USD ट्रेडिंग: 2024-11-07
AUD/USD तकनीकी विश्लेषण सारांश
उपरोक्त 0.66456
Buy Stop
से नीचे 0.65117
Stop Loss
| संकेतक | संकेत |
| RSI | तटस्थ |
| MACD | खरीदें |
| Donchian Channel | तटस्थ |
| MA(200) | बेचना |
| Fractals | तटस्थ |
| Parabolic SAR | खरीदें |
AUD/USD चार्ट विश्लेषण
AUD/USD तकनीकी विश्लेषण
The AUDUSD technical analysis of the price chart on 4-hour timeframe shows AUDUSD, H4 is retracing up toward the 200-period moving average MA(200) following a decline to three-month low yesterday. We believe the bullish momentum will continue after the price breaches above the upper bound of the Donchian channel at 0.66456. A level above this can be used as an entry point for placing a pending order to buy. The stop loss can be placed below 0.65117. After placing the order, the stop loss is to be moved to the next fractal low indicator, following Parabolic signals. Thus, we are changing the expected profit/loss ratio to the breakeven point. If the price meets the stop loss level without reaching the order, we recommend cancelling the order: the market has undergone internal changes which were not taken into account.
मौलिक विश्लेषण FOREX - AUD/USD
Australia’s trade surplus fell more than forecast in September. Will the AUDUSD price retreating resume?
Australia’s trade surplus fell more than forecast in September: the Australian Bureau of Statistics reported the seasonally adjusted goods trade balance fell to A$4.61 billion from A$5.28 billion surplus in August, when an decrease to A$5.24 billion was forecast. Exports fell 4.3% from a month earlier driven by Other mineral fuels. Imports also decreased - by 3.1% driven mainly by declines in Fuels and lubricants. Worse than expected Australian goods trade surplus is bearish for AUDUSD. However, the current setup is bullish for the pair. At the same time, the Federal Reserve is widely expected to cut interest rates by 25 basis points. Fed rate cuts are bearish for US dollar and bullish for AUDUSD currency pair.
ध्यान दें:
यह ओवरव्यू एक जानकारीपूर्ण और ट्यूटोरियल चरित्र है और मुफ्त में प्रकाशित किया जाता है. सभी डेटा, ओवरव्यू में शामिल, सार्वजनिक स्रोतों से प्राप्त कर रहे हैं, कम या ज्यादा विश्वसनीय रूप में मान्यता प्राप्त. अतिरिक्त, संकेत दिया जानकारी पूर्ण और सटीक है कि कोई गारंटी नहीं है. ओवरव्यू अद्यतन नहीं हैं . प्रत्येक ओवरव्यू में पूरी जानकारी, भी शामिल राय, इंडीकेटर्स , चार्ट और कुछ और, परिचय उद्देश्यों के लिए ही प्रदान की जाती है और वित्तीय सलाह या सिफारिश नहीं है. पूरे पाठ और उसके किसी भी हिस्से, और साथ हीचार्ट किसी भी संपत्ति के साथ एक सौदा करने के लिए एक प्रस्ताव के रूप में नहीं माना जा सकता है . IFC मार्केट्स और किसी भी परिस्थिति में अपने कर्मचारियों को किसी और के द्वारा की गई किसी कार्रवाई के दौरान लिए उत्तरदायी नहीं हैं या ओवरव्यू पढ़ने के बाद.


