- एनालिटिक्स
- टेक्निकल एनालिसिस
Apple तकनीकी विश्लेषण - Apple ट्रेडिंग: 2024-11-01
Apple तकनीकी विश्लेषण सारांश
से नीचे 224.98
Sell Stop
उपरोक्त 231.54
Stop Loss
| संकेतक | संकेत |
| RSI | खरीदें |
| MACD | बेचना |
| Donchian Channel | बेचना |
| MA(200) | खरीदें |
| Fractals | बेचना |
| Parabolic SAR | बेचना |
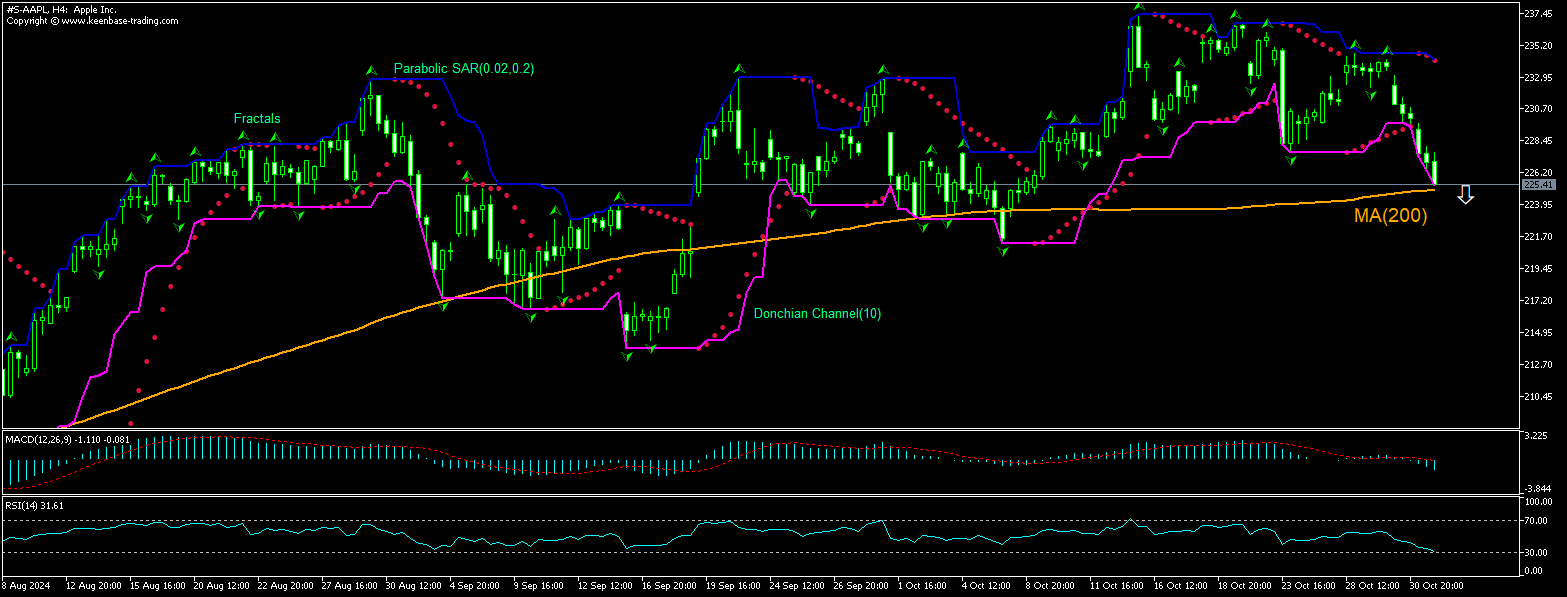
Apple चार्ट विश्लेषण
Apple तकनीकी विश्लेषण
The technical analysis of the Apple stock price chart on 4-hour timeframe shows #S-AAPL, H4 is retesting the 200-period moving average MA(200) after retracing lower following rebound to all-time high two weeks ago. RSI is about to cross into the oversold zone. We believe the bearish momentum will continue after the price breaches below the lower boundary of Donchian channel at 224.98. This level can be used as an entry point for placing a pending order to sell. The stop loss can be placed above 231.54. After placing the order, the stop loss is to be moved every day to the next fractal high indicator, following Parabolic signals. Thus, we are changing the expected profit/loss ratio to the breakeven point. If the price meets the stop loss level (231.54) without reaching the order (224.98), we recommend cancelling the order: the market has undergone internal changes which were not taken into account.
मौलिक विश्लेषण शेयरों - Apple
Apple share price ended lower in after-hours trading yesterday after iPhone maker reported above expected quarterly sales and earnings. Will the Apple stock price continue retreating?
Apple reported yesterday overall fourth-quarter sales rose 6.1% to $94.93 billion, ahead of Wall Street targets of $94.58 billion. Earnings per share also exceeded analysts’ expectations: $1.64 versus $1.60. However, the company guidance for the next quarter fell short of Wall Street expectations: Apple expects overall revenue to "grow low to mid-single digits" during its fiscal first quarter which ends in December, while analysts had expected revenue growth of 6.65% to $127.53 billion. Another point of disappointment was the reported decline in Q4 China sales. Expectations of lower sales growth are bearish for the Apple stock price.
ध्यान दें:
यह ओवरव्यू एक जानकारीपूर्ण और ट्यूटोरियल चरित्र है और मुफ्त में प्रकाशित किया जाता है. सभी डेटा, ओवरव्यू में शामिल, सार्वजनिक स्रोतों से प्राप्त कर रहे हैं, कम या ज्यादा विश्वसनीय रूप में मान्यता प्राप्त. अतिरिक्त, संकेत दिया जानकारी पूर्ण और सटीक है कि कोई गारंटी नहीं है. ओवरव्यू अद्यतन नहीं हैं . प्रत्येक ओवरव्यू में पूरी जानकारी, भी शामिल राय, इंडीकेटर्स , चार्ट और कुछ और, परिचय उद्देश्यों के लिए ही प्रदान की जाती है और वित्तीय सलाह या सिफारिश नहीं है. पूरे पाठ और उसके किसी भी हिस्से, और साथ हीचार्ट किसी भी संपत्ति के साथ एक सौदा करने के लिए एक प्रस्ताव के रूप में नहीं माना जा सकता है . IFC मार्केट्स और किसी भी परिस्थिति में अपने कर्मचारियों को किसी और के द्वारा की गई किसी कार्रवाई के दौरान लिए उत्तरदायी नहीं हैं या ओवरव्यू पढ़ने के बाद.


