- एनालिटिक्स
- टेक्निकल एनालिसिस
USD/CHF तकनीकी विश्लेषण - USD/CHF ट्रेडिंग: 2025-01-07
USD/CHF तकनीकी विश्लेषण सारांश
से नीचे 0.90076
Sell Stop
उपरोक्त 0.91070
Stop Loss
| संकेतक | संकेत |
| RSI | तटस्थ |
| MACD | बेचना |
| Donchian Channel | तटस्थ |
| MA(200) | खरीदें |
| Fractals | बेचना |
| Parabolic SAR | बेचना |
USD/CHF चार्ट विश्लेषण
USD/CHF तकनीकी विश्लेषण
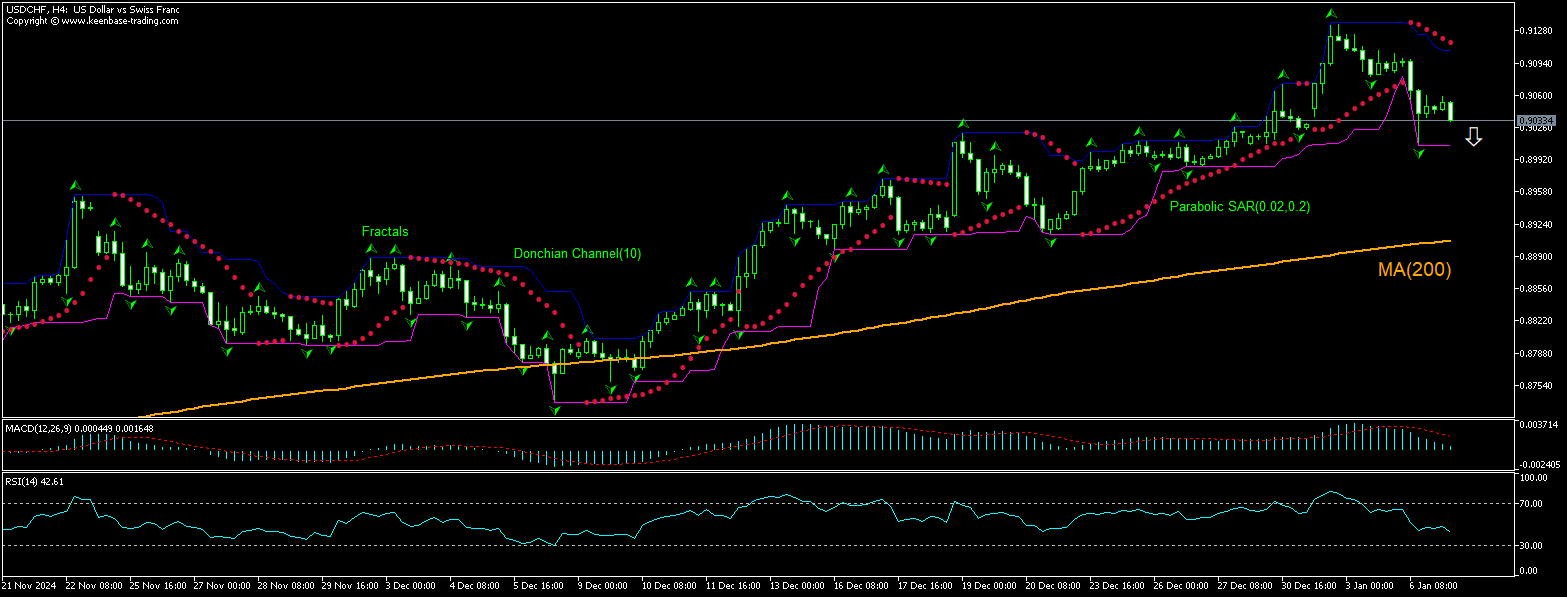
The USDCHF technical analysis of the price chart on 4-hour timeframe shows USDCHF, H4 is retracing down toward the 200-period moving average MA(200) after hitting seven-month high in the first trading session of 2025. We believe the bearish movement will continue after the price breaches below the lower bound of the Donchian channel at 0.90076. A level below this can be used as an entry point for placing a pending order to sell. The stop loss can be placed above 0.91070. After placing the order, the stop loss is to be moved to the next fractal high indicator, following Parabolic signals. Thus, we are changing the expected profit/loss ratio to the breakeven point. If the price meets the stop loss level without reaching the order, we recommend cancelling the order: the market has undergone internal changes which were not taken into account.
मौलिक विश्लेषण FOREX - USD/CHF
Swiss retail sales grew less than expected in November. Will the USDCHF price retreating persist?
Swiss retail sales slowing continued in November: the Federal Statistical Office reported Swiss retail sales grew 0.8% over year in November after 1.4% increase in October, when a 1.3% growth was forecast. Slower sales in non-food products and service stations were offset by accelerated sales in food, beverages and tobacco. Slower growth in retail sales is bearish for Swiss franc as retail sales is a primary component of consumer spending which accounts for the majority of overall economic activity. This is bullish for USDCHF. However, the current setup is bearish for the currency pair.
ध्यान दें:
यह ओवरव्यू एक जानकारीपूर्ण और ट्यूटोरियल चरित्र है और मुफ्त में प्रकाशित किया जाता है. सभी डेटा, ओवरव्यू में शामिल, सार्वजनिक स्रोतों से प्राप्त कर रहे हैं, कम या ज्यादा विश्वसनीय रूप में मान्यता प्राप्त. अतिरिक्त, संकेत दिया जानकारी पूर्ण और सटीक है कि कोई गारंटी नहीं है. ओवरव्यू अद्यतन नहीं हैं . प्रत्येक ओवरव्यू में पूरी जानकारी, भी शामिल राय, इंडीकेटर्स , चार्ट और कुछ और, परिचय उद्देश्यों के लिए ही प्रदान की जाती है और वित्तीय सलाह या सिफारिश नहीं है. पूरे पाठ और उसके किसी भी हिस्से, और साथ हीचार्ट किसी भी संपत्ति के साथ एक सौदा करने के लिए एक प्रस्ताव के रूप में नहीं माना जा सकता है . IFC मार्केट्स और किसी भी परिस्थिति में अपने कर्मचारियों को किसी और के द्वारा की गई किसी कार्रवाई के दौरान लिए उत्तरदायी नहीं हैं या ओवरव्यू पढ़ने के बाद.


