- एनालिटिक्स
- टेक्निकल एनालिसिस
लाइव पशु तकनीकी विश्लेषण - लाइव पशु ट्रेडिंग: 2025-02-18
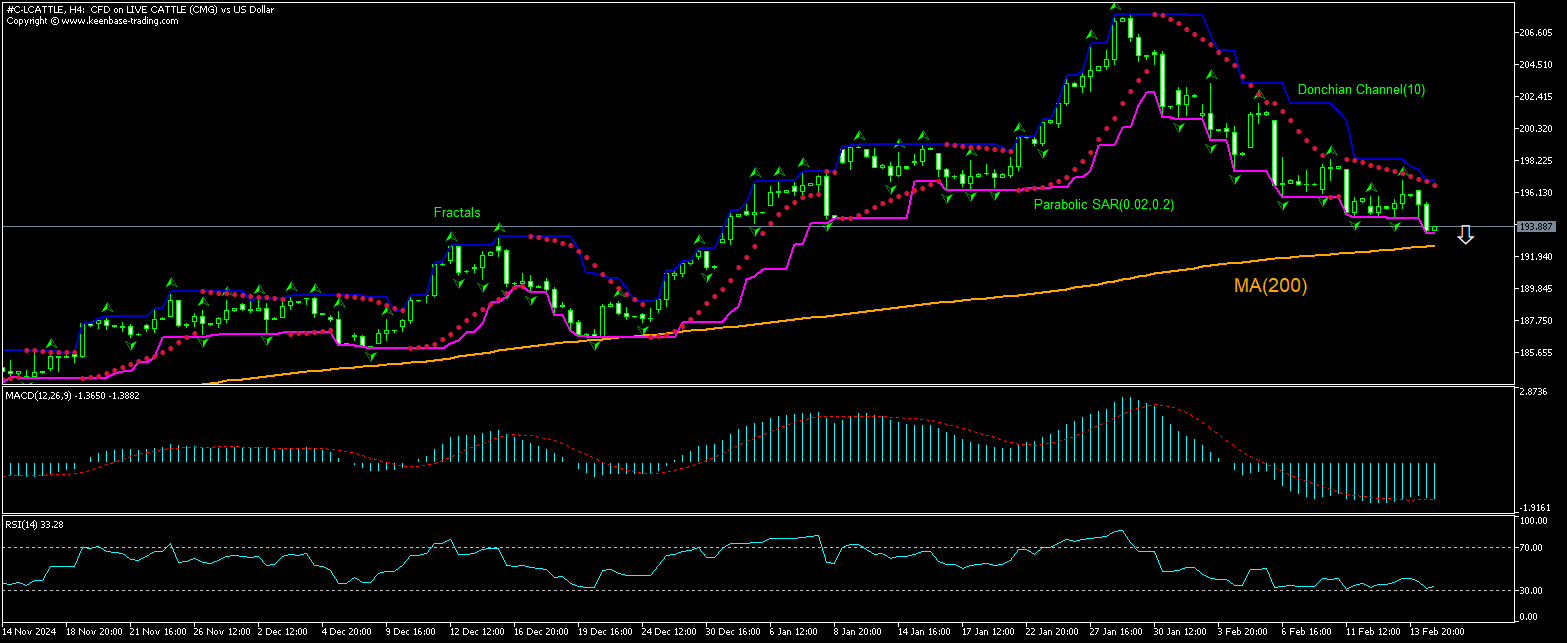
लाइव पशु तकनीकी विश्लेषण सारांश
से नीचे 193.418
Sell Stop
उपरोक्त 196.581
Stop Loss
| संकेतक | संकेत |
| RSI | तटस्थ |
| MACD | बेचना |
| Donchian Channel | तटस्थ |
| MA(200) | खरीदें |
| Fractals | तटस्थ |
| Parabolic SAR | बेचना |
लाइव पशु चार्ट विश्लेषण
लाइव पशु तकनीकी विश्लेषण
The technical analysis of the LCATTLE price chart in 4-hour timeframe shows #C-LCATTLE,H4 is declining to test the 200-period moving average MA(200) after hitting all-time high three weeks ago. We believe the bearish momentum will continue as the price breaches below lower bund of Donchian channel at 193.418. A pending order to sell can be placed below that level. The stop loss can be placed above 196.581. After placing the order, the stop loss is to be moved every day to the next fractal high, following Parabolic signals . Thus, we are changing the expected profit/loss ratio to the breakeven point. If the price meets the stop loss level without reaching the order, we recommend cancelling the order: the market has undergone internal changes which were not taken into account.
मौलिक विश्लेषण कमोडिटीज - लाइव पशु
US cattle slaughter volume fell last week. Will the LCATTLE price retreating continue?
The US Cattle Report indicated domestic cow slaughter numbers are declining: processors slaughtered 561,000 cattle last week - down 23,000 or a 3.9% decrease from last week's 584,000 head. This is one of the smallest full week slaughter volumes in several years. The slaughter volume was also down compared to the same period a year ago: 7.7% or 47,000 lower than the same period in 2024. The report indicates that while last year’s slaughter rates were impaired by winter storms, this year’s reduction is the result of lower demand for beef. Indications of lower demand for beef are bearish for LCATTLE live cattle price.
ध्यान दें:
यह ओवरव्यू एक जानकारीपूर्ण और ट्यूटोरियल चरित्र है और मुफ्त में प्रकाशित किया जाता है. सभी डेटा, ओवरव्यू में शामिल, सार्वजनिक स्रोतों से प्राप्त कर रहे हैं, कम या ज्यादा विश्वसनीय रूप में मान्यता प्राप्त. अतिरिक्त, संकेत दिया जानकारी पूर्ण और सटीक है कि कोई गारंटी नहीं है. ओवरव्यू अद्यतन नहीं हैं . प्रत्येक ओवरव्यू में पूरी जानकारी, भी शामिल राय, इंडीकेटर्स , चार्ट और कुछ और, परिचय उद्देश्यों के लिए ही प्रदान की जाती है और वित्तीय सलाह या सिफारिश नहीं है. पूरे पाठ और उसके किसी भी हिस्से, और साथ हीचार्ट किसी भी संपत्ति के साथ एक सौदा करने के लिए एक प्रस्ताव के रूप में नहीं माना जा सकता है . IFC मार्केट्स और किसी भी परिस्थिति में अपने कर्मचारियों को किसी और के द्वारा की गई किसी कार्रवाई के दौरान लिए उत्तरदायी नहीं हैं या ओवरव्यू पढ़ने के बाद.


