- एनालिटिक्स
- टेक्निकल एनालिसिस
EUR/CHF तकनीकी विश्लेषण - EUR/CHF ट्रेडिंग: 2024-12-10
EUR/CHF तकनीकी विश्लेषण सारांश
से नीचे 0.92579
Sell Stop
उपरोक्त 0.93014
Stop Loss
| संकेतक | संकेत |
| RSI | तटस्थ |
| MACD | बेचना |
| Donchian Channel | तटस्थ |
| MA(200) | बेचना |
| Fractals | बेचना |
| Parabolic SAR | खरीदें |
EUR/CHF चार्ट विश्लेषण
EUR/CHF तकनीकी विश्लेषण
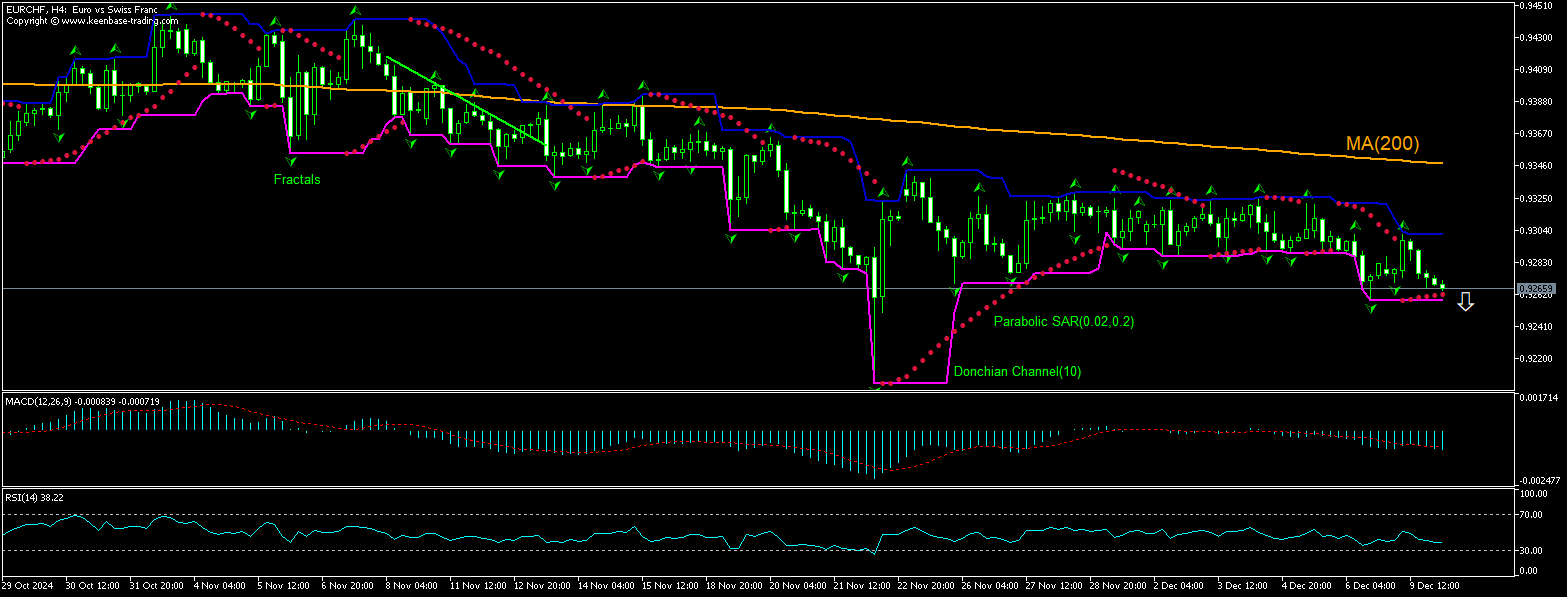
The technical analysis of the EURCHF price chart on 4-hour timeframe shows EURCHF,H4 is declining under the 200-period moving average MA(200) which is declining itself. We believe the bearish momentum will continue after the price breaches below the lower bound of the Donchian channel at 0.92579. A level below this can be used as an entry point for placing a pending order to sell. The stop loss can be placed above 0.93014. After placing the order, the stop loss is to be moved to the next fractal high indicator, following Parabolic signals. Thus, we are changing the expected profit/loss ratio to the breakeven point. If the price meets the stop loss level without reaching the order, we recommend cancelling the order: the market has undergone internal changes which were not taken into account.
मौलिक विश्लेषण FOREX - EUR/CHF
Euro area investor confidence deteriorated in December. Will the EURCHF price decline persist?
Euro area investor confidence deteriorated in December: the Sentix survey results showed Sentix Investor Confidence index declined to -17.5 from -12.8 in November when a slight improvement to -12.4 was forecast. Both the current situation and expectations indicators fell. Deterioration in euro area investor sentiment is bearish for euro and EURCHF. At the same time State Secretariat for Economic Affairs of Switzerland survey results indicate Swiss consumer sentiment is significantly higher than a year ago. Higher Swiss consumer confidence is bullish for Swiss franc and bearish for EURCHF pair.
Explore our
Trading Conditions
- Spreads from 0.0 pip
- 30,000+ Trading Instruments
- Instant Execution
Ready to Trade?
Open Account ध्यान दें:
यह ओवरव्यू एक जानकारीपूर्ण और ट्यूटोरियल चरित्र है और मुफ्त में प्रकाशित किया जाता है. सभी डेटा, ओवरव्यू में शामिल, सार्वजनिक स्रोतों से प्राप्त कर रहे हैं, कम या ज्यादा विश्वसनीय रूप में मान्यता प्राप्त. अतिरिक्त, संकेत दिया जानकारी पूर्ण और सटीक है कि कोई गारंटी नहीं है. ओवरव्यू अद्यतन नहीं हैं . प्रत्येक ओवरव्यू में पूरी जानकारी, भी शामिल राय, इंडीकेटर्स , चार्ट और कुछ और, परिचय उद्देश्यों के लिए ही प्रदान की जाती है और वित्तीय सलाह या सिफारिश नहीं है. पूरे पाठ और उसके किसी भी हिस्से, और साथ हीचार्ट किसी भी संपत्ति के साथ एक सौदा करने के लिए एक प्रस्ताव के रूप में नहीं माना जा सकता है . IFC मार्केट्स और किसी भी परिस्थिति में अपने कर्मचारियों को किसी और के द्वारा की गई किसी कार्रवाई के दौरान लिए उत्तरदायी नहीं हैं या ओवरव्यू पढ़ने के बाद.

