- एनालिटिक्स
- टेक्निकल एनालिसिस
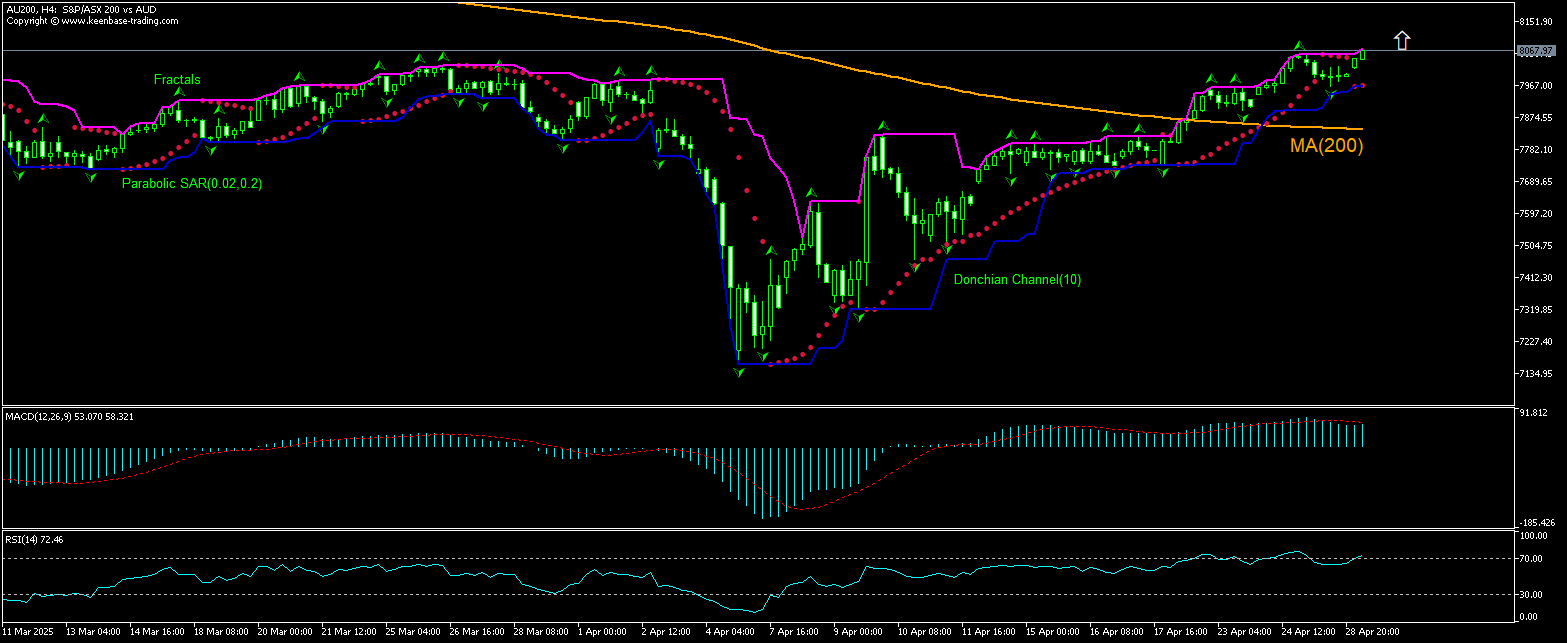
स्टॉक इंडेक्स ऑफ ऑस्ट्रेलिया तकनीकी विश्लेषण - स्टॉक इंडेक्स ऑफ ऑस्ट्रेलिया ट्रेडिंग: 2025-04-29
इंडेक्स ऑफ़ ऑस्ट्रेलियाई सिक्योरिटीज एक्सचेंज तकनीकी विश्लेषण सारांश
उपरोक्त 8079.03
Buy Stop
से नीचे 7970.52
Stop Loss
| संकेतक | संकेत |
| RSI | बेचना |
| MACD | खरीदें |
| Donchian Channel | खरीदें |
| MA(200) | खरीदें |
| Fractals | खरीदें |
| Parabolic SAR | खरीदें |
इंडेक्स ऑफ़ ऑस्ट्रेलियाई सिक्योरिटीज एक्सचेंज चार्ट विश्लेषण
इंडेक्स ऑफ़ ऑस्ट्रेलियाई सिक्योरिटीज एक्सचेंज तकनीकी विश्लेषण
The AU200 technical analysis of the price chart on 4-hour timeframe shows AU200,H4 is rising above the 200-period moving average MA(200) after returning above the MA(200) following a rebound three weeks ago. The RSI indicator is in overbought zone. We believe the bullish momentum will continue after the price breaches above the upper Donchian boundary at 8079.03. This level can be used as an entry point for placing a pending order to buy. The stop loss can be placed below 7970.52. After placing the pending order the stop loss is to be moved every day to the next fractal low indicator, following Parabolic signals. Thus, we are changing the expected profit/loss ratio to the breakeven point. If the price meets the stop-loss level (7970.52) without reaching the order (8079.03) we recommend cancelling the order: the market sustains internal changes which were not taken into account.
मौलिक विश्लेषण इंडिसस - इंडेक्स ऑफ़ ऑस्ट्रेलियाई सिक्योरिटीज एक्सचेंज
Market participants expect inflation in Australia will ease. Will the AU200 price rebound persist ?
Investors expect Australia’s annual inflation rate to fall to 2.3% in Q1, easing from 2.4% in Q4. Markets are pricing in a quarter-point rate cut by the Reserve Bank of Australia in May against the backdrop of continuing concerns over the global trade environment driven by US tariff policy uncertainties. If price data confirm consumer inflation in Australia continues declining, investors expect the central bank will have more justification for monetary easing which will provide more support for stock prices. Expectations of easing Australian consumer inflation are bullish for AU200 stock index.
ध्यान दें:
यह ओवरव्यू एक जानकारीपूर्ण और ट्यूटोरियल चरित्र है और मुफ्त में प्रकाशित किया जाता है. सभी डेटा, ओवरव्यू में शामिल, सार्वजनिक स्रोतों से प्राप्त कर रहे हैं, कम या ज्यादा विश्वसनीय रूप में मान्यता प्राप्त. अतिरिक्त, संकेत दिया जानकारी पूर्ण और सटीक है कि कोई गारंटी नहीं है. ओवरव्यू अद्यतन नहीं हैं . प्रत्येक ओवरव्यू में पूरी जानकारी, भी शामिल राय, इंडीकेटर्स , चार्ट और कुछ और, परिचय उद्देश्यों के लिए ही प्रदान की जाती है और वित्तीय सलाह या सिफारिश नहीं है. पूरे पाठ और उसके किसी भी हिस्से, और साथ हीचार्ट किसी भी संपत्ति के साथ एक सौदा करने के लिए एक प्रस्ताव के रूप में नहीं माना जा सकता है . IFC मार्केट्स और किसी भी परिस्थिति में अपने कर्मचारियों को किसी और के द्वारा की गई किसी कार्रवाई के दौरान लिए उत्तरदायी नहीं हैं या ओवरव्यू पढ़ने के बाद.


